Traffic Control Display
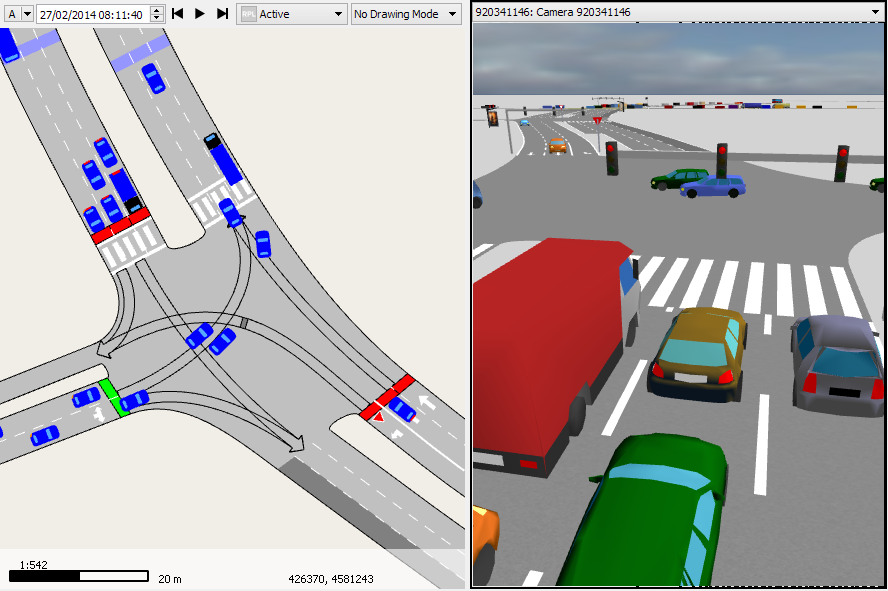
The current state of the traffic signals can be observed during the simulation run in both the 2D and 3D views. The signals are represented by colored bars on the road in 2D and as overhead gantry signals in 3D
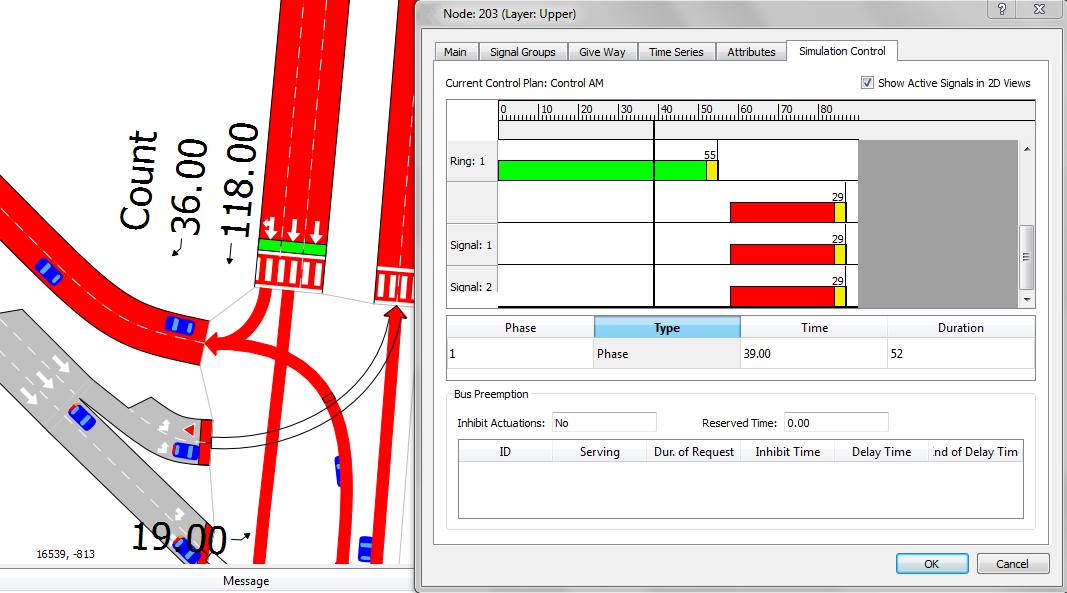
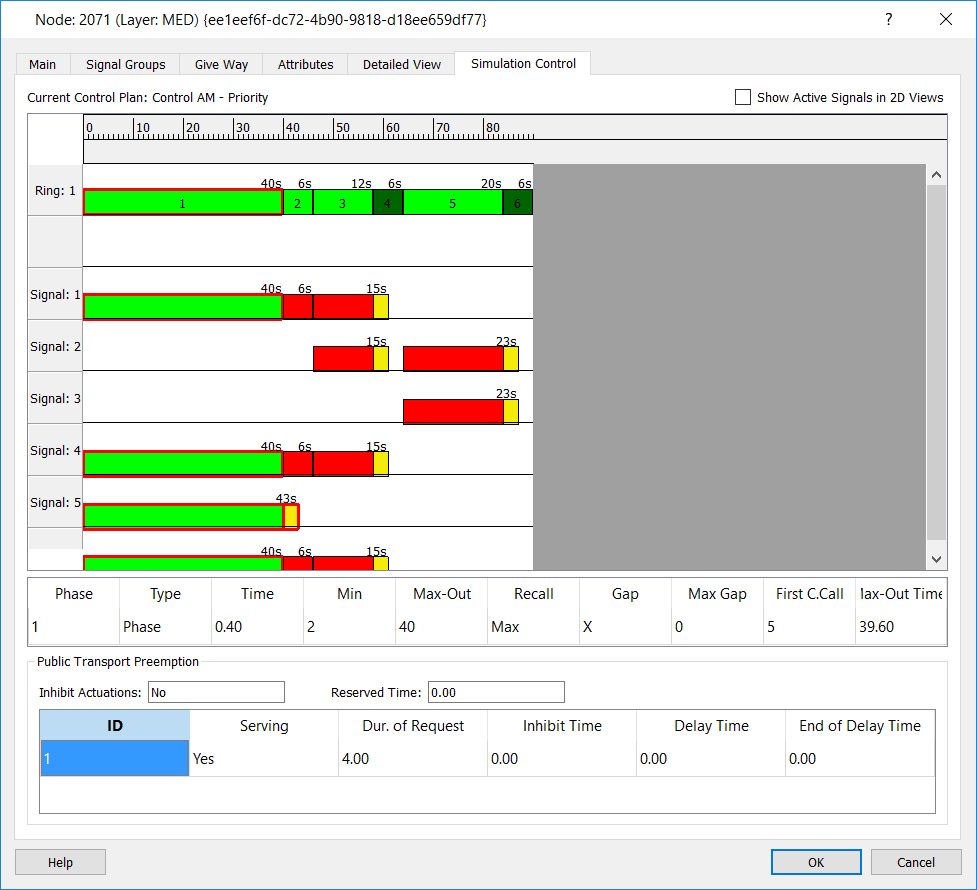
As the simulation runs, the Node Editor will have a Simulation Control tab (see next figure). This tab shows a graphical representation of the traffic control plan with the active phases highlighted. When the intersection traffic signals follow a fixed control, a vertical line in the phases and signals graphic indicates the current position in the control plan cycle.
The option Show Active Signals In View will show the current permitted movements in the primary color in the 2D view.
Below the graphical representation, there is a table that lists, for a fixed control: the phase that is currently active, the phase type (that is, Phase or Interphase), the time it has been active so far, and the duration of the phase.
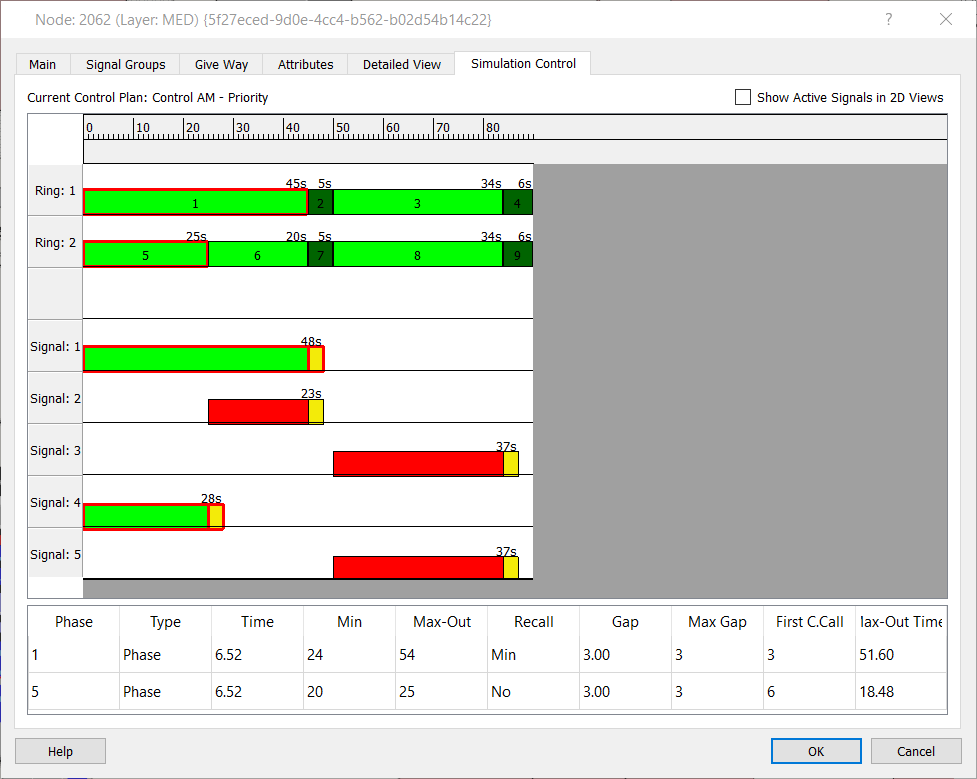
When the control is Actuated, the table lists the following data (see next figure) for each ring:
- the number of the phase currently active
- the type of phase currently active, whether Phase or Interphase
- the time the phase has been active so far
- the minimum Green Time of the phase
- the maximum time the phase can last
- the type of recall: no recall, minimum or maximum recall, or coordinated.
- the current gap from the moment the last vehicle crossed the corresponding detector.
- the current max gap allowed for that phase
- the phase producing the first conflicting call, that makes the max-out counter start counting down
- the max-out counter, showing the maximum number of seconds left for that phase
The Priority parameters are also listed in a table (see next figure):
- whether actuations are inhibited or not
- the reserved time
- the ID of the dwell phase
- the serving state: whether the dwell phase is currently active (Yes) or not (No)
- the current duration of request
- the time during which actuations are inhibited
- the delay time
- the end of delay time counter
Use of Traffic Signals View and Map View
Combining the traffic signals view with the Calibration: Color by Turn view mode is useful in debugging network behavior For example: .
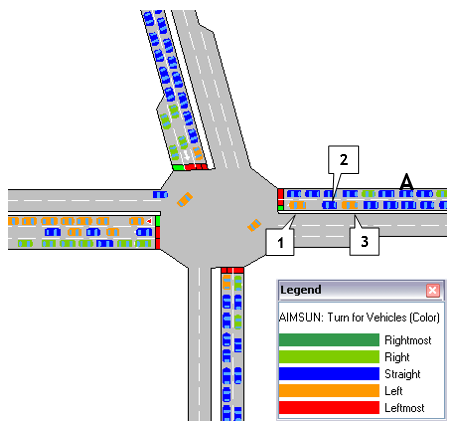
If a particular lane has different turn movements belonging to separate signal groups that have right of way during different phases, it means that different traffic lights can be in operation for the same lane at the same time. This is represented by dividing the stop line for that lane into as many portions as there are different signal groups applicable in that lane. Vehicles will be allowed to cross or not depending on the turn movement they intend to make.
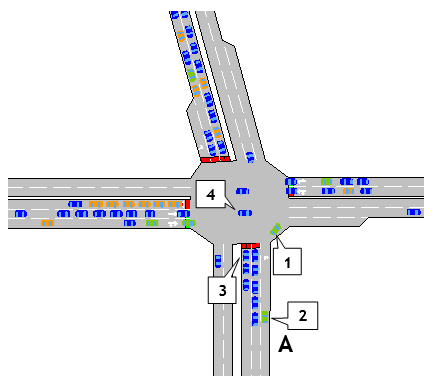
In the example displayed in next figure, vehicles in the leftmost lane of section A can either go straight or turn left. The traffic light for a straight turn is red while it is green for a left turn. Vehicle 1 wishes to turn left and the traffic light for a left turn is green, therefore it will cross. However, vehicle 2 wants to go straight, therefore it will stop at the stop line, thus blocking vehicle 3 that wishes to turn left.
It is also possible to define turn movements that have right of way during the whole cycle. This would be the case of a lane that has no traffic light (or a permanent green light) and it is achieved by not assigning the turn movement to any signal group. The next figure shows an example of a right turn that can always be taken, hence no stop line is painted for the rightmost lane of section A. Vehicles 1 and 2 are crossing while the traffic light for section A is red and vehicles 3 are stopped.
Take into account that in the node control illustrated in next figure, vehicle 4 does not have priority defined over vehicles 1 and 2. To properly model turns with permanent green or flashing yellow, it would be proper to include a Yield sign in the right turn movement.
