Understanding the Elasticities in an OD Adjustment
The weights in both the Static and the Dynamic OD Adjustment processes control how important a role each component of the objective function plays in the iterative process. For the OD term, the weight is defined through the user-defined elasticity value. The aim of the adjustment process is to minimize the following objective function after every iteration.

These components measure the Goodness-of-Fit (GoF):
- \(γ_{1}\frac12(G-\hat{G})^2\) refers to the difference between the current adjusted OD matrix and the seed OD matrix, where:
- \(γ_{1}\): weight factor with respect to the traffic demand (OD matrices)
- \(G\): adjusted OD matrix
- \(\hat{G}\): seed OD matrix
- \(γ_{2}\frac12(V(G)-\hat{V})^2\) refers to the difference between the current adjusted volumes and the observed measurements, where:
- \(γ_{2}\): weight factor for the observed measurements, with a range between 0 and 1
- \(V(G)\): adjusted volumes updated after every iteration
- \(\hat{V}\): observed measurements read from the Real Data Set
- \(γ_{3}\frac12(P-\hat{P})^2\) refers to the difference between the current adjusted trip length distribution and the base one obtained from the first iteration (available only in the Static OD Adjustment), where:
- \(γ_{3}\): weight factor for the trip length distribution
- \(P\): updated trip length for OD trips split per 1-km cells, calculated in every iteration
- \(\hat{P}\): trip length for OD trips split per 1-km cells in the first iteration
Figure 1 shows that in both the Dynamic (left window) and the Static (right window) OD Adjustment experiment tabs you can set the demand elasticity (\(e_{1}\)) per User Class. The trip length distribution elasticity (\(e_{3}\)) can be set per User Class in the Static OD Adjustment only. Once set, both the Demand and the Trip Length Distribution elasticities are translated into the weights (\(γ_{1}\)) and (\(γ_{3}\)) using the following formula: \(γ_{a}= \frac{1}{e_{a}}-1\)
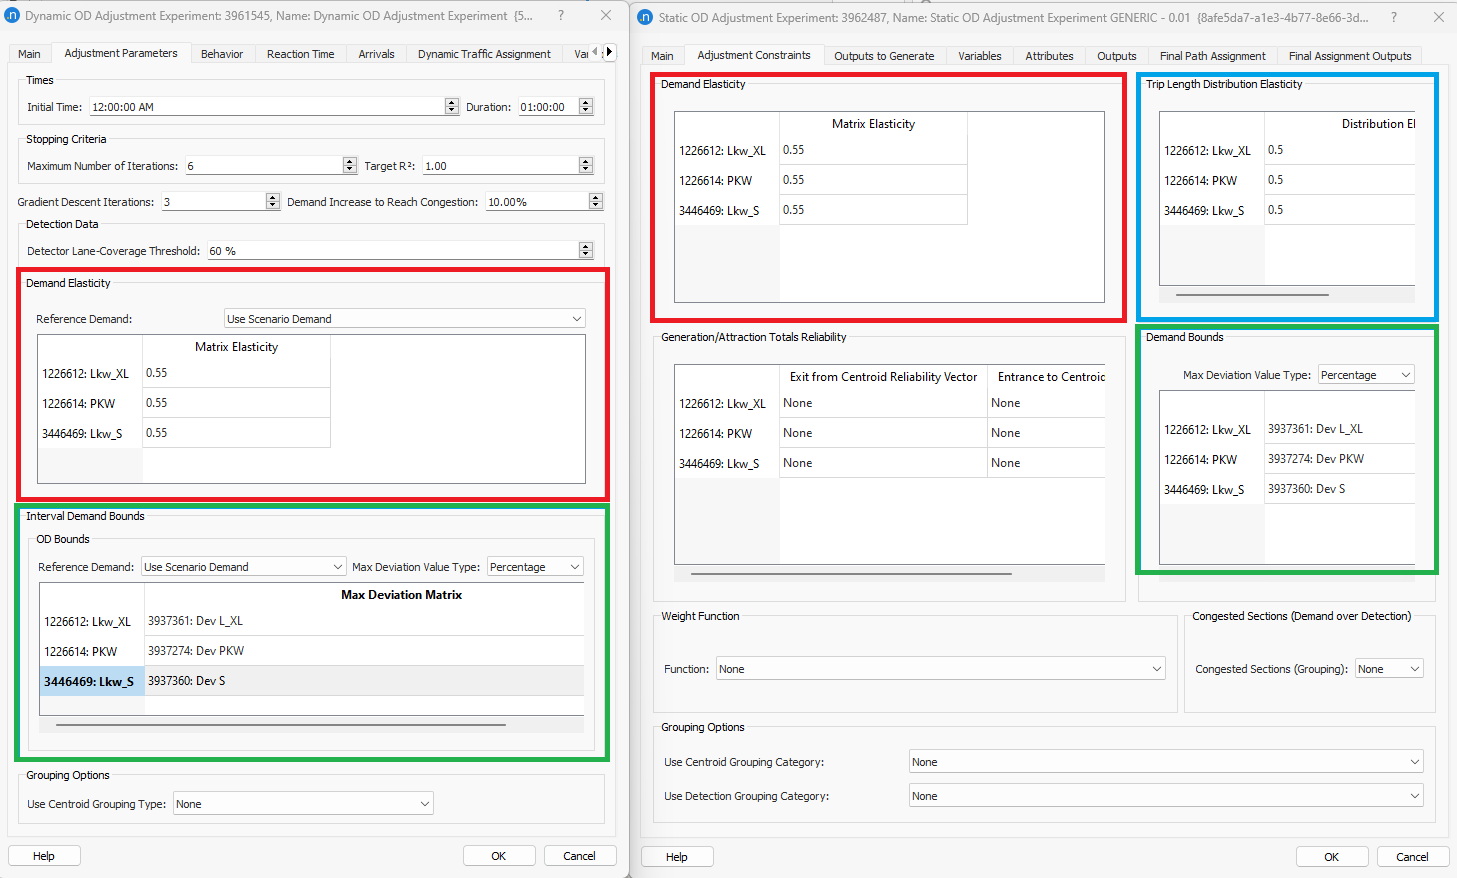
The weighting factors \(γ_{1}\), \(γ_{2}\) and \(γ_{3}\) reflect the uncertainty of the information contained in the seed OD matrix, the observed counts and the observed TLD, respectively.
The value for the weight \(γ_{2}\) is taken from the Real Data Set if it includes a per-measurement value named Reliability. The adjustment process uses this value as the weight for the difference between observed and assigned data: the larger the Reliability, the more this error term contributes to the overall objective function. The Reliability can take values between 0 and 1.
In more detail, the weight \(γ_{2}\) starts at a default value of 1.0 and then depends on the following conditions:
- Reliability: if the RDS has a reliability column, the weight is multiplied by the value in that column.
- Weight Function (only in Static OD Adjustment): the weight is multiplied by the value obtained from evaluating the Weight Function.
- Detection Coverage (only Detectors & Detector Stations): the number of lanes of the section covered by the detector or station, divided by the total number of lanes (similarly for turnings). The weight is multiplied by this value.
The weight is therefore calculated as:
\(weight = 1.0 * Reliability * WeightFunction * DetectorCoverage\)
The elasticities measure how firmly the adjusted matrix is anchored to the prior matrix, but other conditions can constrain the adjusted value as well, such as the Demand Bounds, which are specified through a matrix of constraints per cell and per User Class.
If the prior OD matrix for one user class is well established and known to be accurate, then a demand elasticity close to zero would be appropriate, so that the structure of the initial OD matrix is preserved. Conversely, if the prior matrix is less accurate – perhaps derived from an older model, or where subsequent land-use changes are known to have occurred – then the matrix would be expected to change more significantly in the adjustment scenario. A demand elasticity value (\(e_{1}\)) closer to 1 would then be appropriate.
The trip length distribution elasticity should be set in the same spirit. In most cases, however, the difference \((P-\hat{P})^2\) ends up being very small, because it compares two percentages. Very low elasticity values are therefore needed for this term to influence the OD adjustment process.
The elasticity values cannot be prescribed in advance, because the vectors and parameters in the objective function depend on many factors: the size of the network, the type of the network (urban, interurban, mixed), the number of ODs, the size of the traffic demand, the number of detectors, the reliability of the data, the magnitude of the detector data, and so on. Values that work in one project may therefore not produce the same outcome in another. Our recommendation is to start with some values and run several tests to understand the impact of each elasticity in the process, and then fine-tune each elasticity value.
The examples below test a range of elasticity values and may help you understand their impact on the adjustment process. Note that some of these values are not realistic, but were chosen to show the limits of the adjustment process. For instance:
- An elasticity of 0.01 gives the OD term a weight of 99, which expresses a very high confidence in the initial OD matrix
- A weight of 1 for the count term means that the observed counts are trusted much less in comparison
The weight of the OD term (that is, the elasticity) has to be chosen in relation to how well the initial matrix already reproduces the observed counts (RDS). So if the weight for the counts is always 1, the elasticity values should stay between 0.5 and 1; below that range, you are assuming that the initial matrix is more trustworthy than the RDS.
Elasticities and User Classes
Elasticities are set per User Class, and each User Class is adjusted with its own step size. The elasticity chosen for one User Class therefore does not restrict how much the other User Classes are adjusted. This matters most for the Trip Length Distribution Elasticity, where very low values are common: setting it to 0.000001 for a single class gives that class a weight of 999999, which effectively freezes its trip length distribution so that its demand is barely modified, while the remaining classes continue to be adjusted normally. A warning is written to the log for every User Class whose Trip Length Distribution Elasticity is close to zero, so that an effectively frozen class is visible in the results.
The User Classes are not fully independent, however, because they share the observed measurements. A detector count reflects the flow of every User Class that uses that section, so the trips of one class always take part in the error term \((V(G)-\hat{V})^2\) that drives the adjustment of the others. Adding or removing a User Class from the demand, or changing its elasticities, will therefore also change the adjusted result of the remaining classes. What each elasticity controls independently is how firmly its own class is anchored to its own seed matrix and its own trip length distribution.
Demand Elasticity
The elasticity values for the demand control how much the values in the adjusted matrix can vary in the adjustment procedure.
It can be understood as the strength of the reactive force that opposes the changes of the demand with respect to the reference demand.
An elasticity value closer to zero gives the OD term a high weight in the objective function, so the deviation from the seed demand is small. When the elasticity is 1, the weighting factor is 0 (see the formula above), which means that the OD term is not considered in the objective function at all. Removing this term gives the algorithm the flexibility to search a wider space of solutions instead of restricting the deviation, so an elasticity value of 1 can be selected in cases where the quality of the seed OD matrix is not good.
In short, the closer to 0 the stronger this reaction is to any deviation from the original demand, whereas the closer to 1, the weaker it is. In the corner case where it is 0, there is no reaction to a change from the original demand.
Example
In a sample network, keeping all the other input parameters fixed, we tested the following six values of demand elasticities:
\(e_{1}\) = {0.01, 0.1, 0.5, 0.75, 0.9, 1.0}
To translate those elasticities into a weight (\(γ_{1}\)) used in the objective function, we apply the formula: \(γ_{1}= \frac{1}{e_{1}}-1\).
\(γ_{1}\)= {99, 9, 1, 0.333, 0.111, 0}
The result of the static assignment before the adjustment:
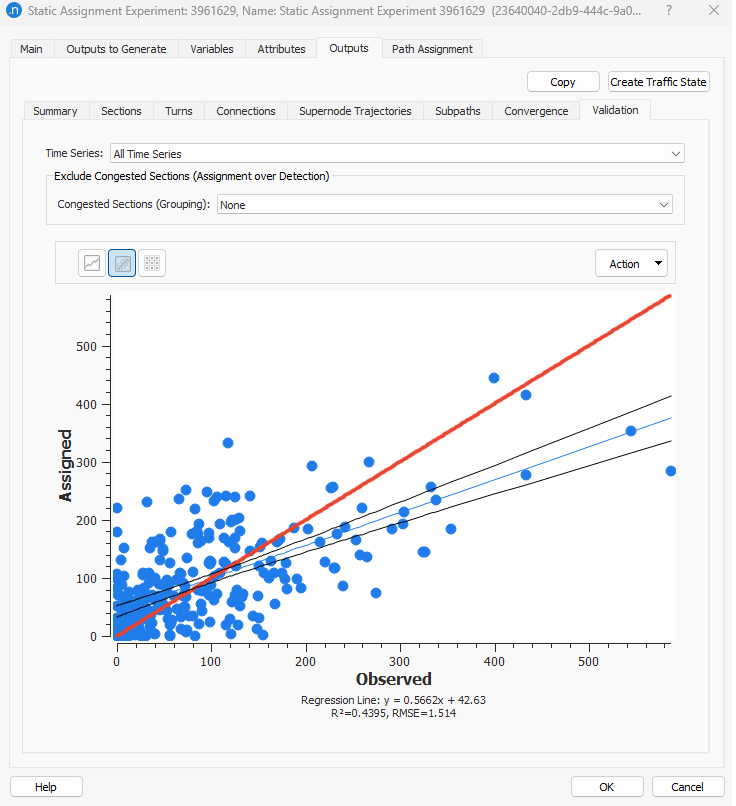
What we expect to see from this experiment is that an elasticity close to 0 (high weight) restricts the adjustment of the OD trips of the seed matrix: the process does not allow the cells to change significantly along the iterations, so it cannot modify the demand enough to improve the validation. As a consequence of this restriction, the Trip Length Distribution is expected to stay close to the result of the first iteration of the adjustment. In contrast, a demand elasticity close to 1 (low weight) gives the cells in the seed OD matrix the freedom to move the OD trips so that the validation improves, and the Trip Length Distribution then changes significantly as the trips are redistributed among the bins.
The experiments produced the following results:
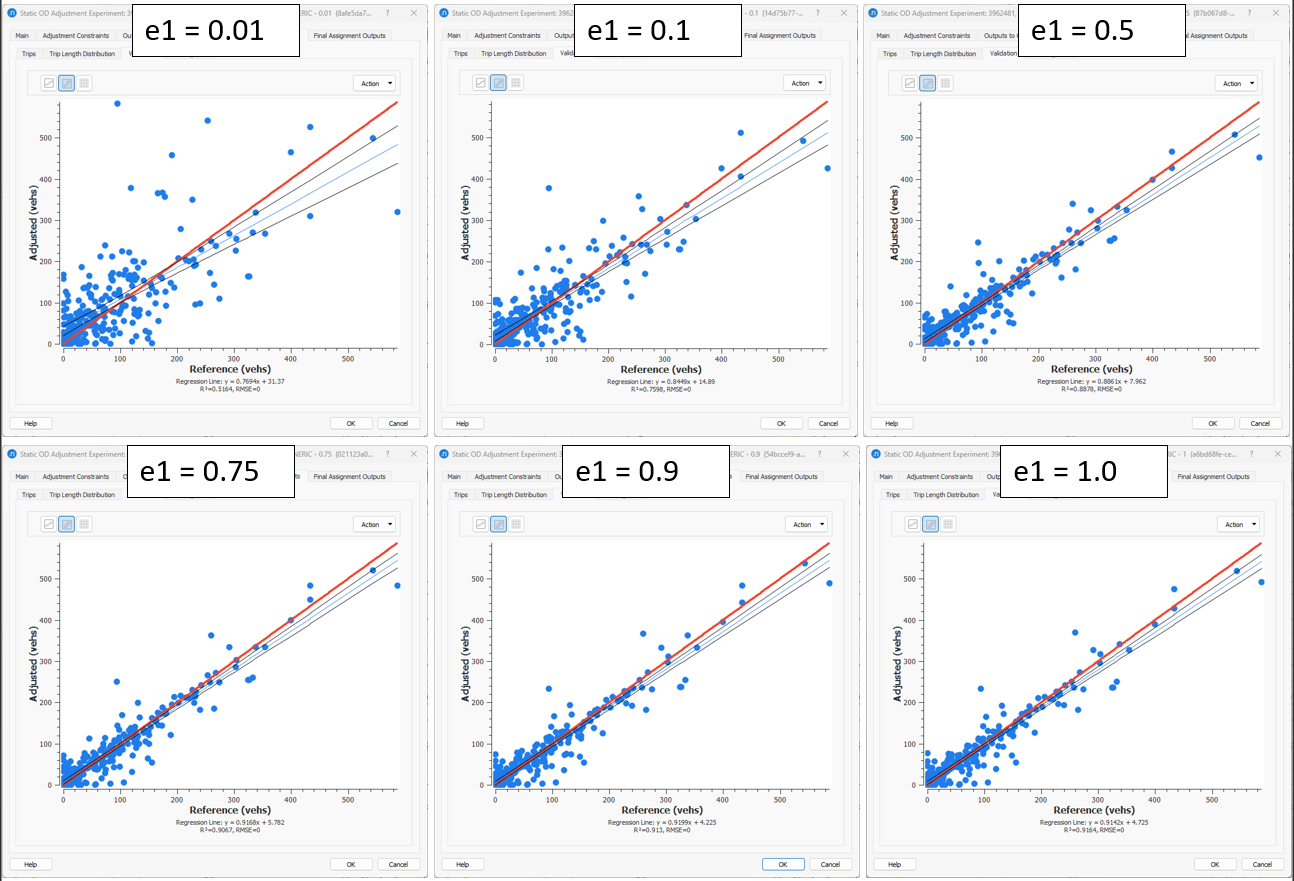
Validation tab
With small demand elasticity values (for example 0.01), the validation between adjusted and reference volumes did not improve, because the OD trips were not modified sufficiently. With the demand elasticity close to 1 (for example 0.9), the validation R2 and Slope improved.
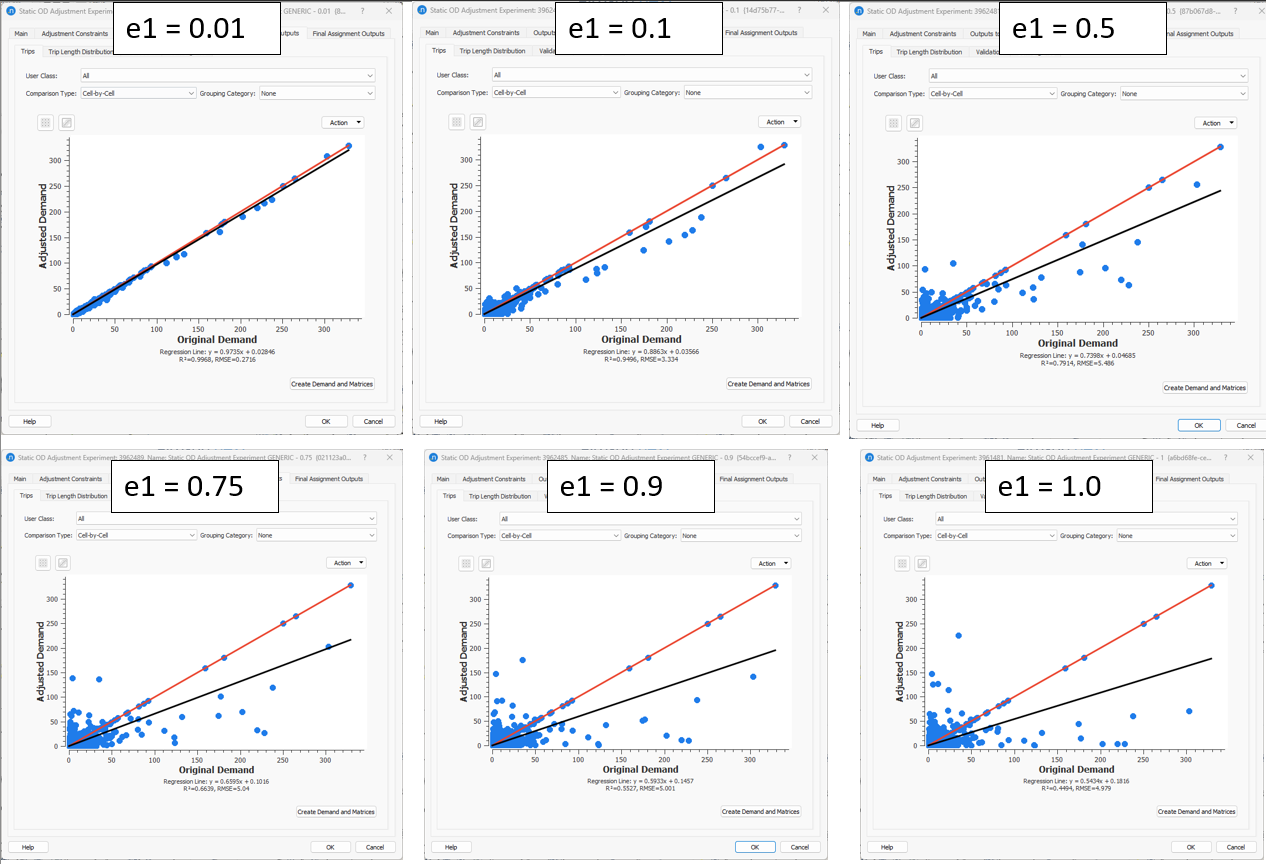
Trips tab
With small demand elasticity values the OD trips were not modified sufficiently, whereas with the demand elasticity set close to 1 the adjustment process had more freedom to modify the OD trips in the seed matrix.
Trip Length Tab
When the demand elasticity is set close to 0, the Trip Length Distribution does not change, as the trips remain almost the same.
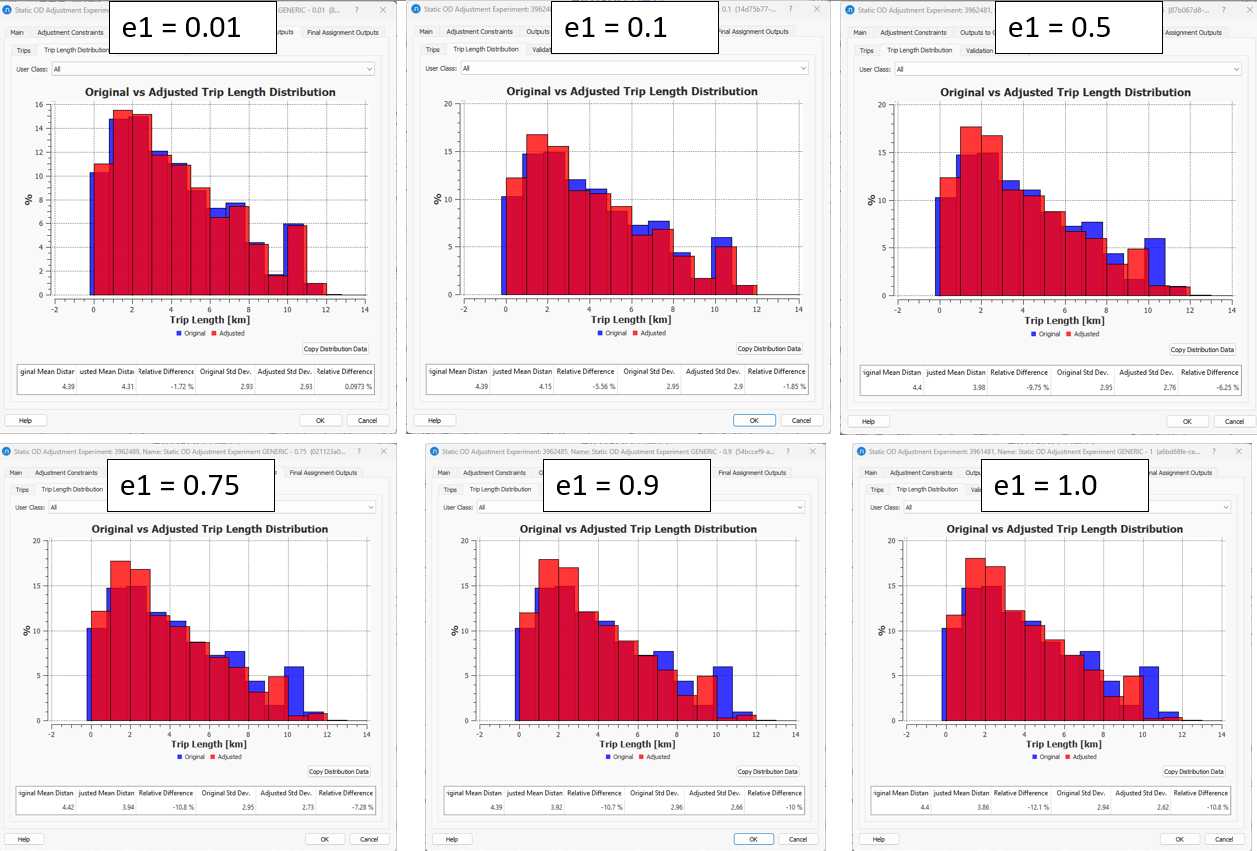
The conclusion is that the closer the demand elasticity value is set to 1, the more freedom the cells in the seed matrix have to adjust, and the more the validation criteria (R2, Slope) improve.
Again, these are only examples, and the elasticity values tested were chosen arbitrarily, so do not take them as the default values for your project.
Trip Length Distribution Elasticity
The Trip Length Distribution Elasticity is only defined in the Static OD Adjustment Experiment.
The Trip Length Distribution uses the same concept of elasticity as the demand. Here, however, the comparison is not between the reference and the adjusted demands, but between the bins of the original trip length distribution, calculated after the first iteration, and the bins of the final iteration. The bins are the OD trips aggregated in cells of 1-km ranges (0-1, 1-2, 2-3...13-14).
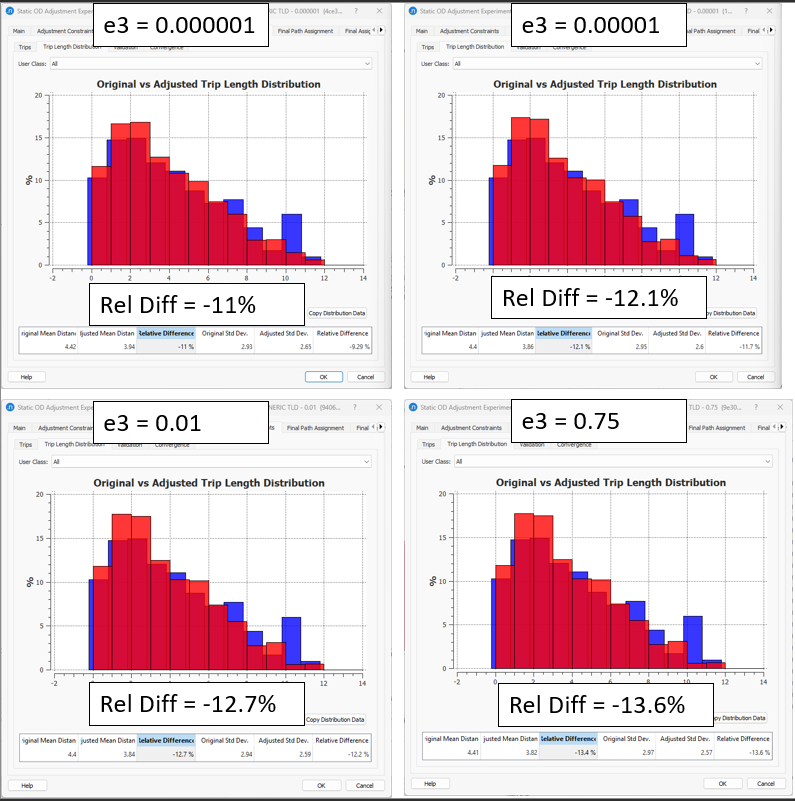
In a sample network, keeping all the other input parameters fixed, we tested the following four values of trip length distribution elasticities:
\(e_{3}\) = {0.000001, 0.00001, 0.01, 0.75}
To translate those elasticities into a weight (\(γ_{3}\)) used in the objective function, we apply the formula: \(γ_{3}= \frac{1}{e_{3}}-1\).
\(γ_{3}\)= {999999, 99999, 99, 0.333}
See the comparison of the first iteration result (in blue) and the final result of the static OD adjustment (in red):
Again, these are only examples, and the elasticity values tested were chosen arbitrarily, so do not take them as the default values for your project.
Demand Bounds
The Max Deviation Matrix can be used as a boundary that limits the variation of the new OD trips calculated after each iteration. The demand bound value of each OD cell acts as a safety mechanism, keeping the adjustment process from moving too far from the reference seed OD matrix.
Example:
For a single OD pair that goes from A to B:
- The seed OD Matrix has 100 trips
- The detector measured 10 vehicles passing on average
- The Max Deviation Matrix is set to 50%, which means that the adjusted OD matrix can take values from 50 to 150 trips.
After iteration 1: 83 trips -> OK
After iteration 2: 64 trips -> OK
After iteration 3: 35 trips -> adjusted to 50 trips
After iteration 4: 45 trips -> adjusted to 50 trips
...
After iteration N: 22 trips -> adjusted to 50 trips
Demand Bounds and Demand Elasticities are two completely different concepts.
Demand Bounds: any change within the range defined is accepted. Which change? That is up to the optimization algorithm using the counts — it does not matter whether the change is larger or smaller.
Elasticity: any change is accepted. Which change? Again up to the optimization algorithm using the counts, but any deviation from the seed OD demand is penalized.
When the demand bounds are set to Frozen, they are applied to limit the OD pairs. The demand bounds are applied at the last step of the adjustment in every iteration: the value changes first, and the constraints are then enforced. So in the case of frozen ODs, their value is set back to the initial OD value after every gradient descent step.