Data Comparison
This tool performs comparative analyses of results from different replications, results, averages, experiments, real data sets, in the project in the form of a view mode in the main 2D view and a table or a regression plot in the dialog.
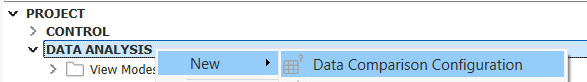
A new Data Comparison Configuration can be started from the Data Analysis folder in the Project window or from the Data Analysis: Data Comparison menu option. Data Comparison Configuration objects can be renamed, edited, and deleted from their context menu.
Data Comparison Dialog
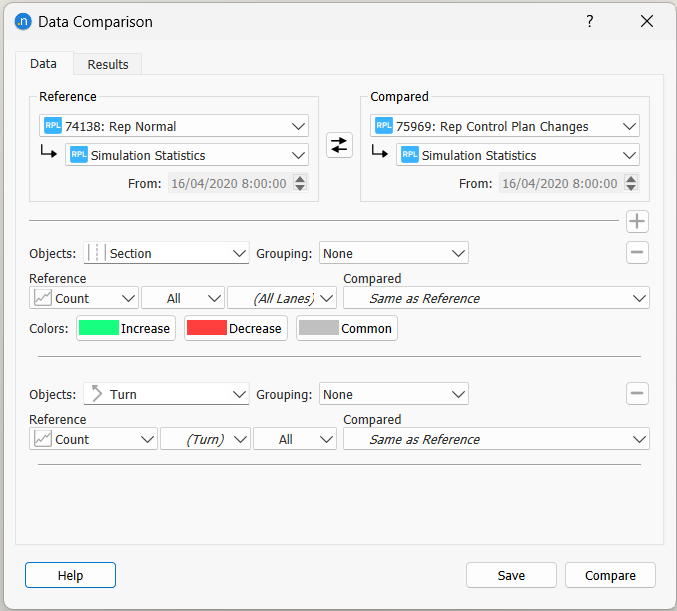
The default reference and compared outputs originators are specified and their order can be inverted.
A comparison type is added using the + button (up to 3 types) and deleted using the - button. On each comparison type define:
- The type of object used in comparison. This can be one of: Section, Detector, Detector Station, Centroid Connection, Grouping, Node, Subpath, Turn, Transit Line, Transit Station, Transit Stop. The list of available objects will depend on the type of experiment to be compared. For example, Transit Line, Station and Stop will appear when comparing Static Transit Assignment results, but not when comparing Microsimulation replications.
- (Optional) A Grouping that contains the objects to compare. If no Grouping is defined, all objects will be compared.
- The Reference and Compared attributes are specified individually. There is no requirement for the same data to be used: for example, a dynamic simulation achieved speed can be compared with the speed limit for the section. Those variables which have time series data are flagged with a small graph icon. Where there are disaggregation options for the variable, i.e. in the case of speed and flow by lane and by user class, these context sensitive selection options are presented.
- For sections, the colors for the common values and the difference, shaded according to its sign.
Once the comparison has been configured, click on the Compare button to perform it and the Save button to store the configuration in the Aimsun document as an object in the Project window, under the Data Analysis folder.
Comparison Result
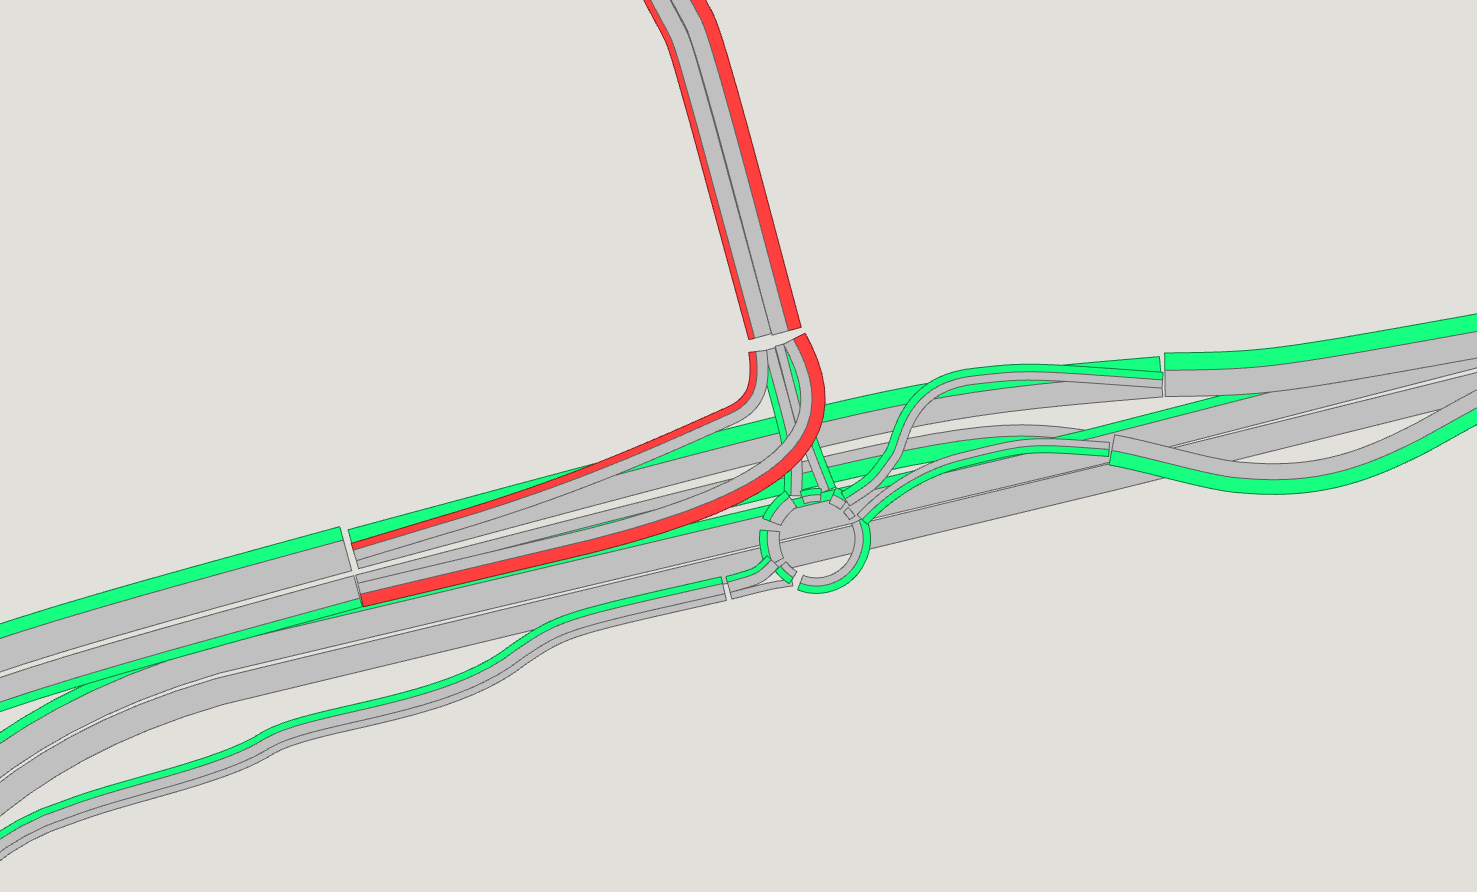
The comparison result is shown in the 2D view with the common values and the differences shaded for sections, and a blue to red color ramp for the rest of objects. The comparison generates a new View Mode which can be edited using the View Mode Editor to customize the view and the associated View Styles.
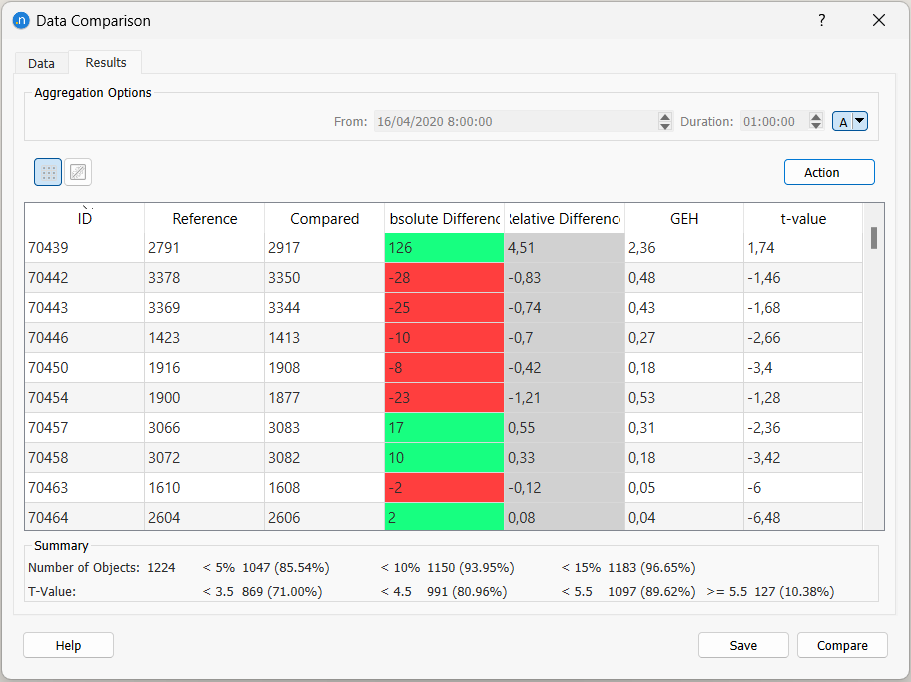
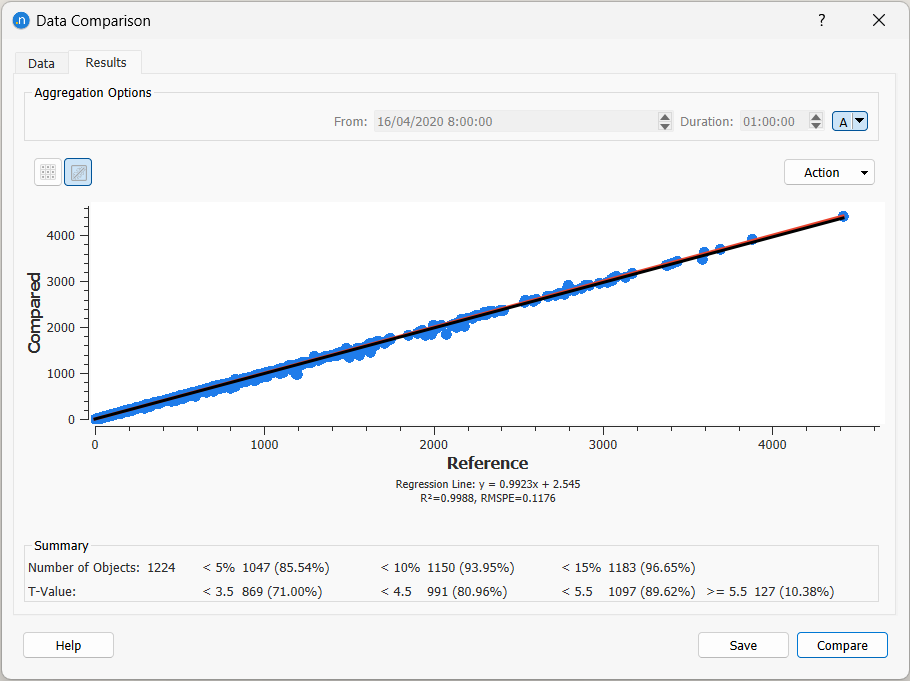
The Results tab of the Comparison dialog displays comparison as a table or as a regression analysis with graphical outputs.
The date and duration of the comparison can be adjusted in the Results tab to focus the analysis on a smaller time period. The type of aggregate used can be adjusted to use the mean, minimum, maximum, or sum.
From the Action button, the data can be copied as a snapshot to place a copy of the graph image on the system clipboard or Copy table Data option is used to copy the data to the clipboard so it can be pasted into other applications such as Microsoft Excel.