Decision Table
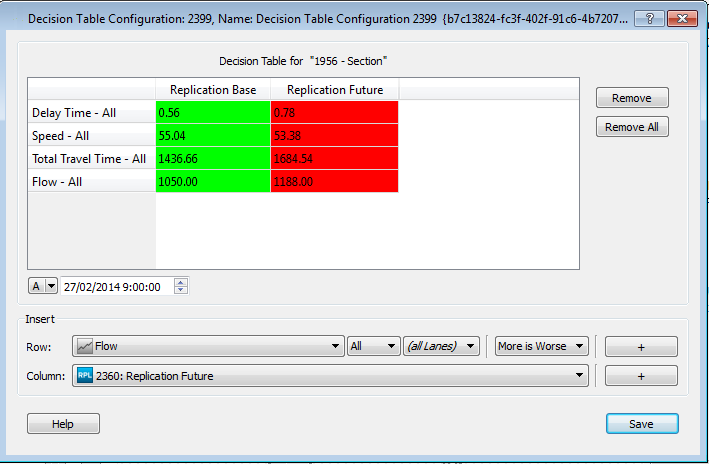
A Decision Table presents an array of simulation results from a single object where the rows represent different variables from the simulation and the columns represent the different experiments and averages from the scenarios in the Project. The table presents a consolidated view of how well that object has performed in each of the experiments with the goal of being able to rapidly identify which one produced the "best" result when several variables are taken into account. Simply identifying the column with the most green selects the best experiment for the results for that object.
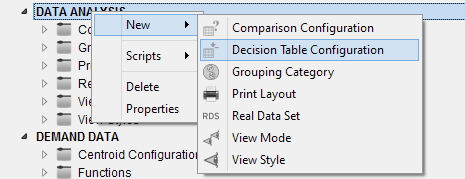
A new Decision Table can be created from the Data Analysis: Decision Table menu option. Decision Table objects can be renamed, edited, and deleted from their context menu.
Decision Tables can also be accessed or started from the context menu of any object in the 2D view.
Decision Table Dialog
Click on an object in the 2D view window to select the object that will be analyzed in this decision table.
The attributes of the object are selected from a drop down combo box to be added as rows in the table. Another combo box sets if a higher value of that particular attribute is considered "better" or "worse". This information is used to color the cells when the calculation is performed. If the attribute can be disaggregated by user class, or by lane, drop down menus are provided to make the selection.
The data can be copied to the system clipboard so it can be pasted into other applications such as Microsoft Excel.