Simulating Pedestrians
Note about licenses: These exercises require a license for Aimsun Next Pro Micro, Advanced, or Expert Edition.
- Exercise 1. Creating a Pedestrian Area
- Exercise 2. Adding More Layers
- Exercise 3. Adding an Entrance and Exits
- Exercise 4. Adding a Pedestrian Type
- Exercise 5. Creating an OD Matrix
- Exercise 6. Changing the Level (via Bridge)
- Exercise 7. Viewing Traffic Control
- Exercise 8. Running the Simulation
- Exercise 9. Including Transit Choices
- Exercise 10. Creating a View Mode
Note that this tutorial uses the native Aimsun Next pedestrian simulator. For information about the alternative Legion simulator, click Legion for Aimsun.
Introduction
In these exercises, we will create a pedestrian area plus all the data required to run a microsimulation of the network with embedded pedestrians.
We will define an area that pedestrians can walk through and areas where there is interaction between vehicles and pedestrians.
In doing so, we will add pedestrian centroids, a pedestrian OD matrix, complete a traffic demand, and run a simulation to see the impact of simulated pedestrians on traffic.
The backup copies of the files related to this exercise are in [Aimsun_Next_Installation_Folder]/docs/tutorials/5_Pedestrian.
Exercise 1. Creating a Pedestrian Area
In this exercise, we will draw the polygonal area in which the simulated pedestrians can move.
To create the pedestrian area:
-
Select File > Open > Initial_Pedestrian.ang.
-
Click the Create Pedestrian Area icon
 .
. -
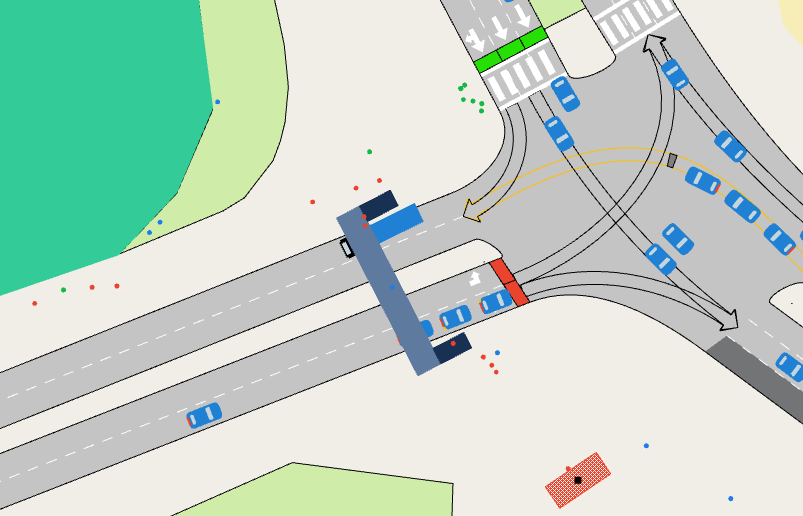
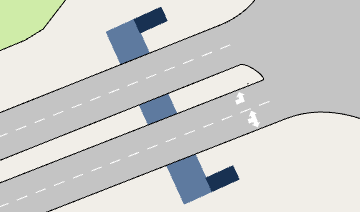
Using the screenshot below as a guide, draw the polygon for the area by clicking its vertices at the required points. To finish and close the polygon, double-click to add the final point.
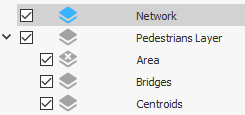
Notice that a new layer named Pedestrians Layer is added to the Layers window.
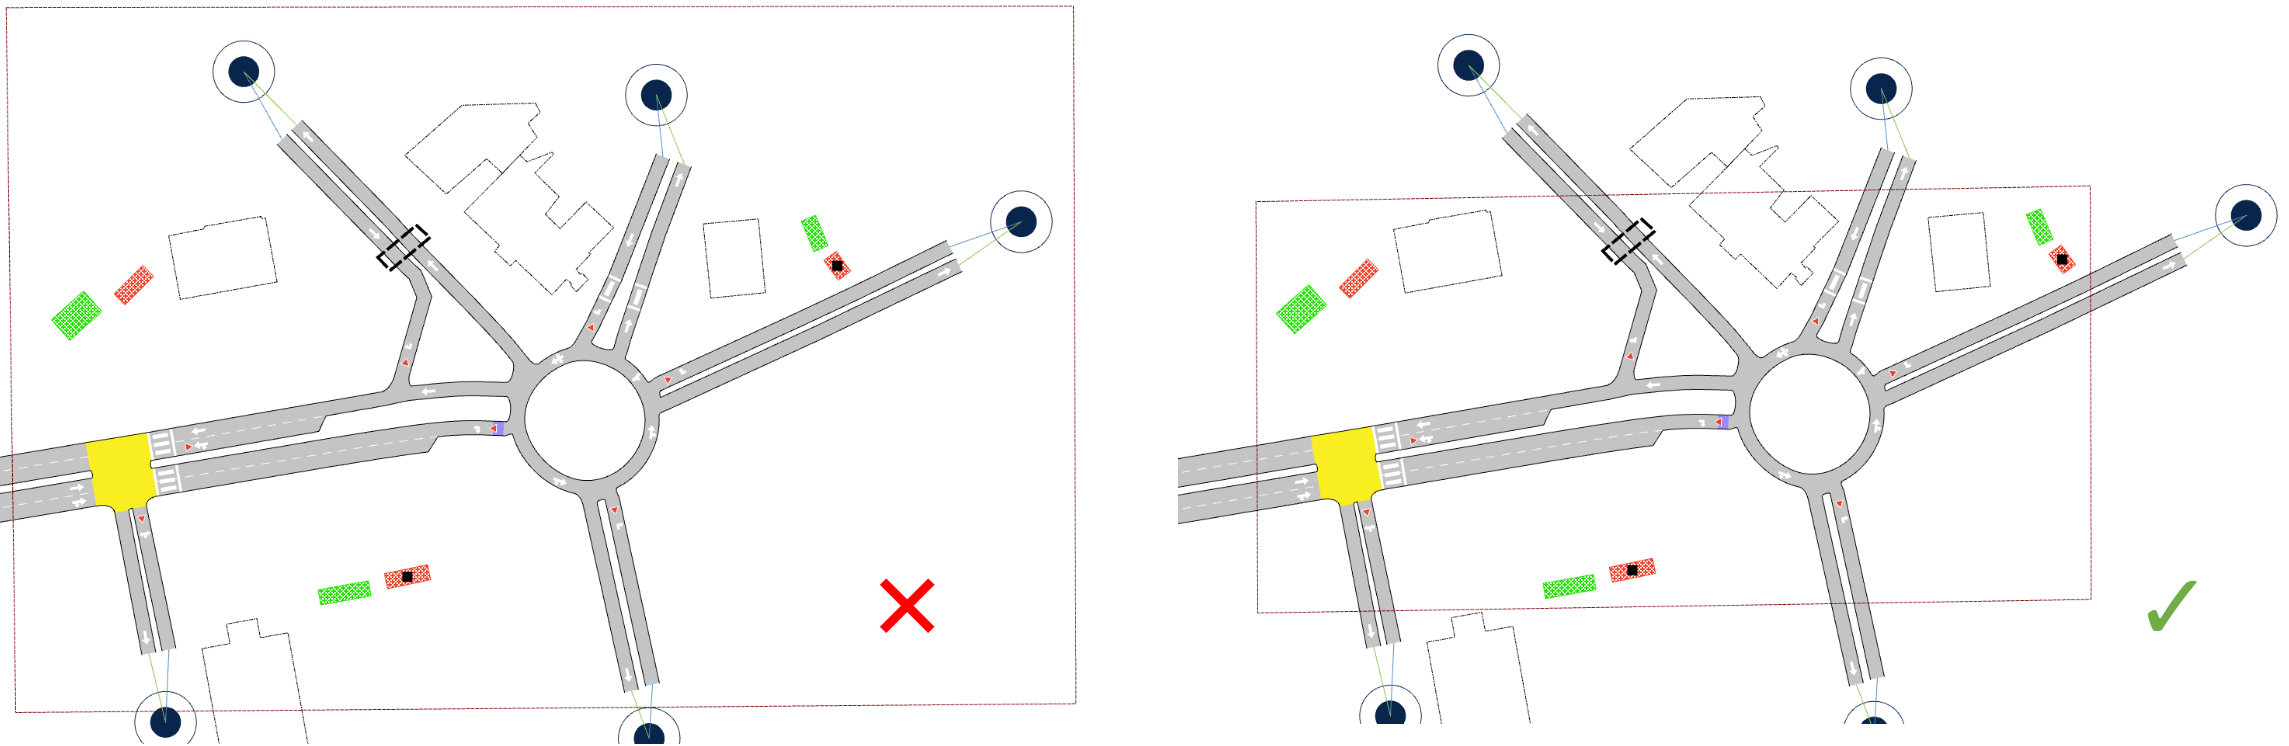
Note: It is important that the pedestrian area does not contain any gaps beyond and around the end of road sections. In the examples below, the area on the right meets this requirement correctly while the left-hand area contains such gaps.
Exercise 2. Adding More Layers
The goal of this exercise is to add layers in which we can organize the different graphical aspects of the pedestrian area. Such organization enables us to show those details we require but hide anything that is not needed in the simulation. We will start by adding three new layers to the Pedestrians Layer.
To add more layers:
-
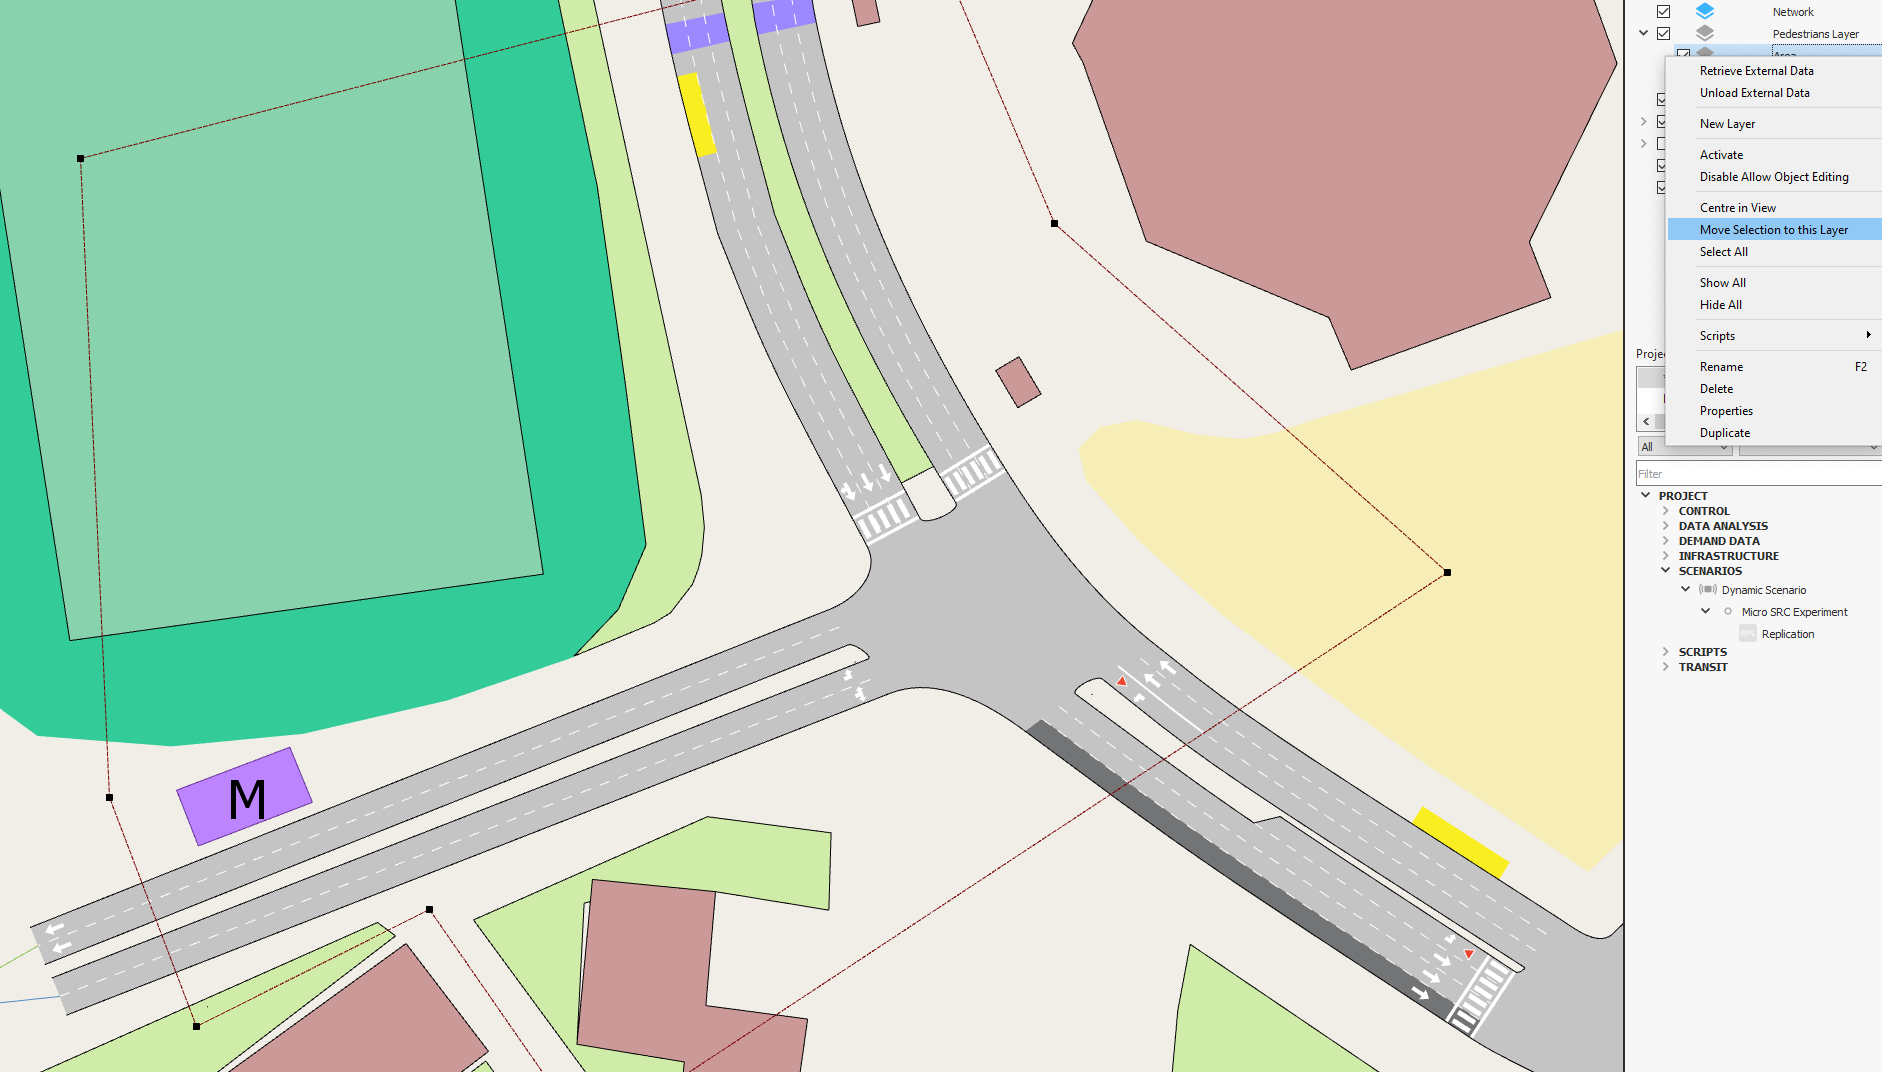
Right-click Pedestrians Layer > New Layer.
-
Repeat twice more until you have three new Untitled layers.
-
Rename these layers Area, Bridges, and Centroids.
The next steps moves the pedestrian area we created to the Area layer.
-
Click to select the pedestrian area.
-
Right-click Area > Move selection to this layer.
-
Open the Area layer and untick the box Allow Object Editing.
This last step means that the pedestrian area cannot be changed or edited until this parameter is unticked.
Exercise 3. Adding an Entrance and Exits
In this exercise we will add entrances  and exits
  to enable simulated pedestrians to enter and leave the network within the pedestrian area. As we draw them in the model, we will add them to the activated Centroids layer.
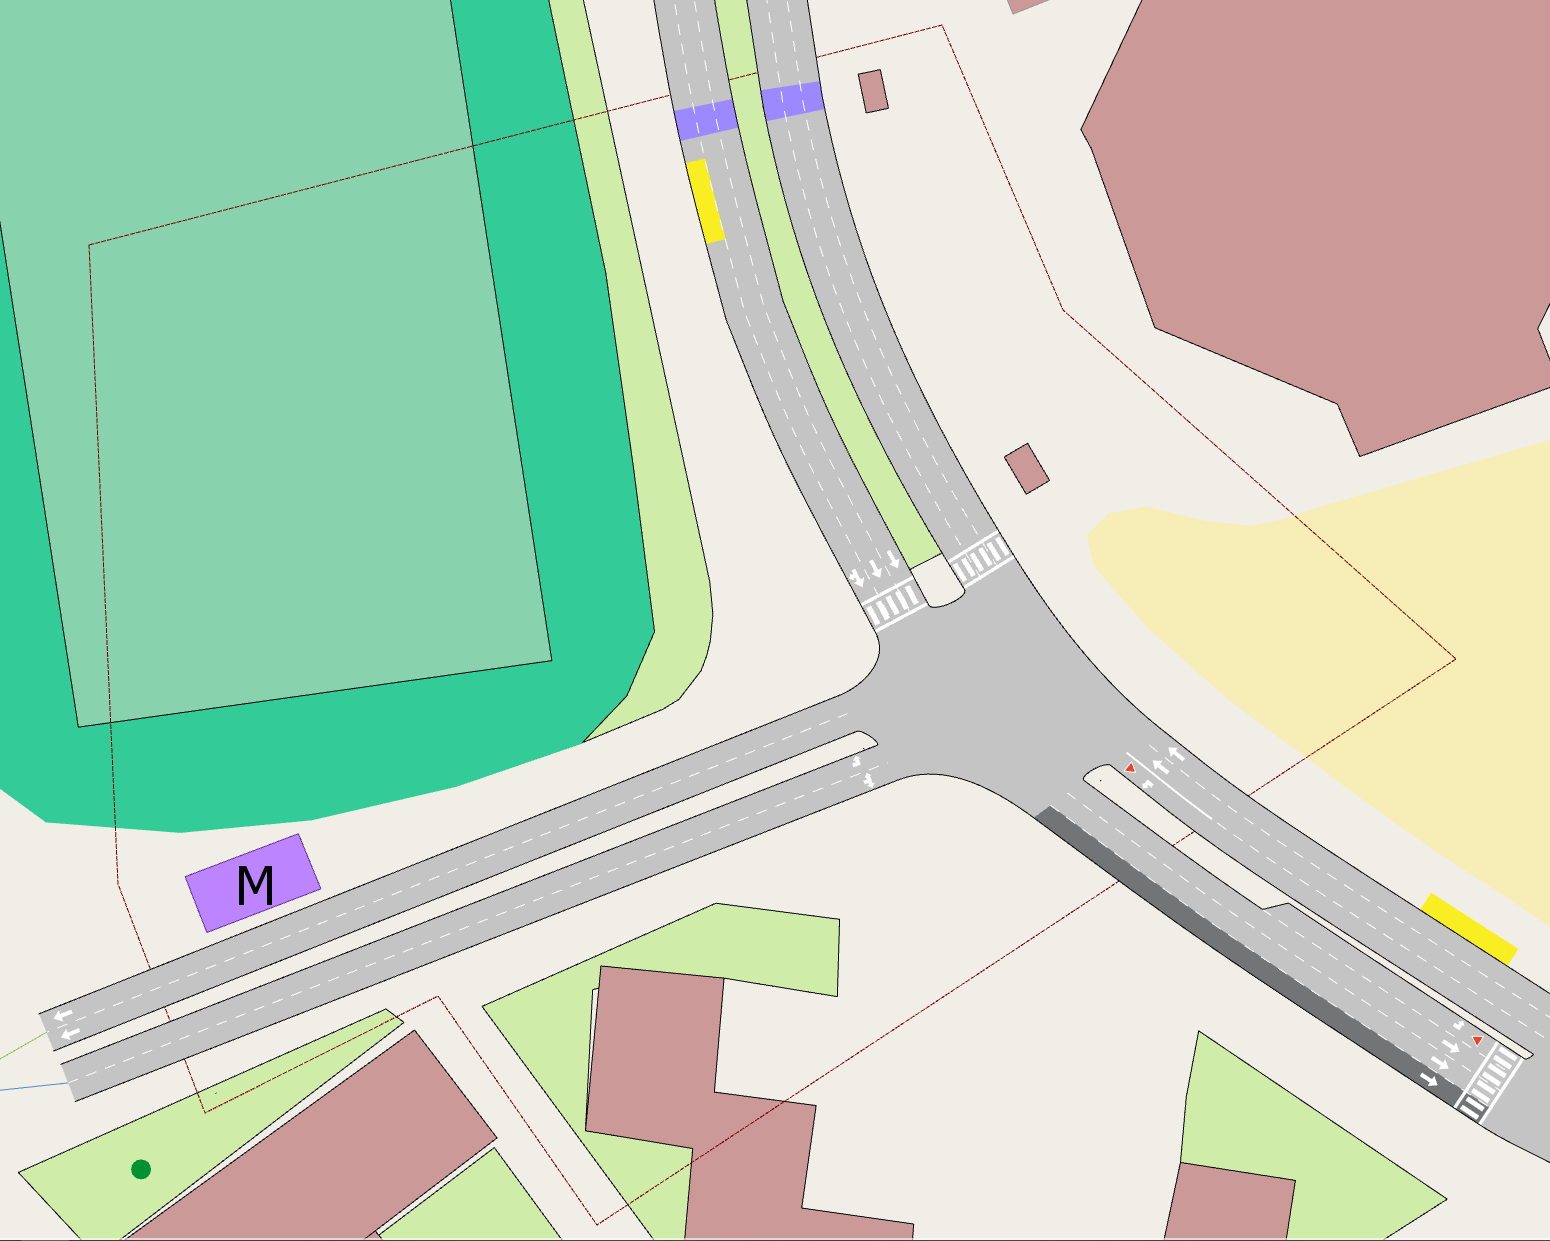
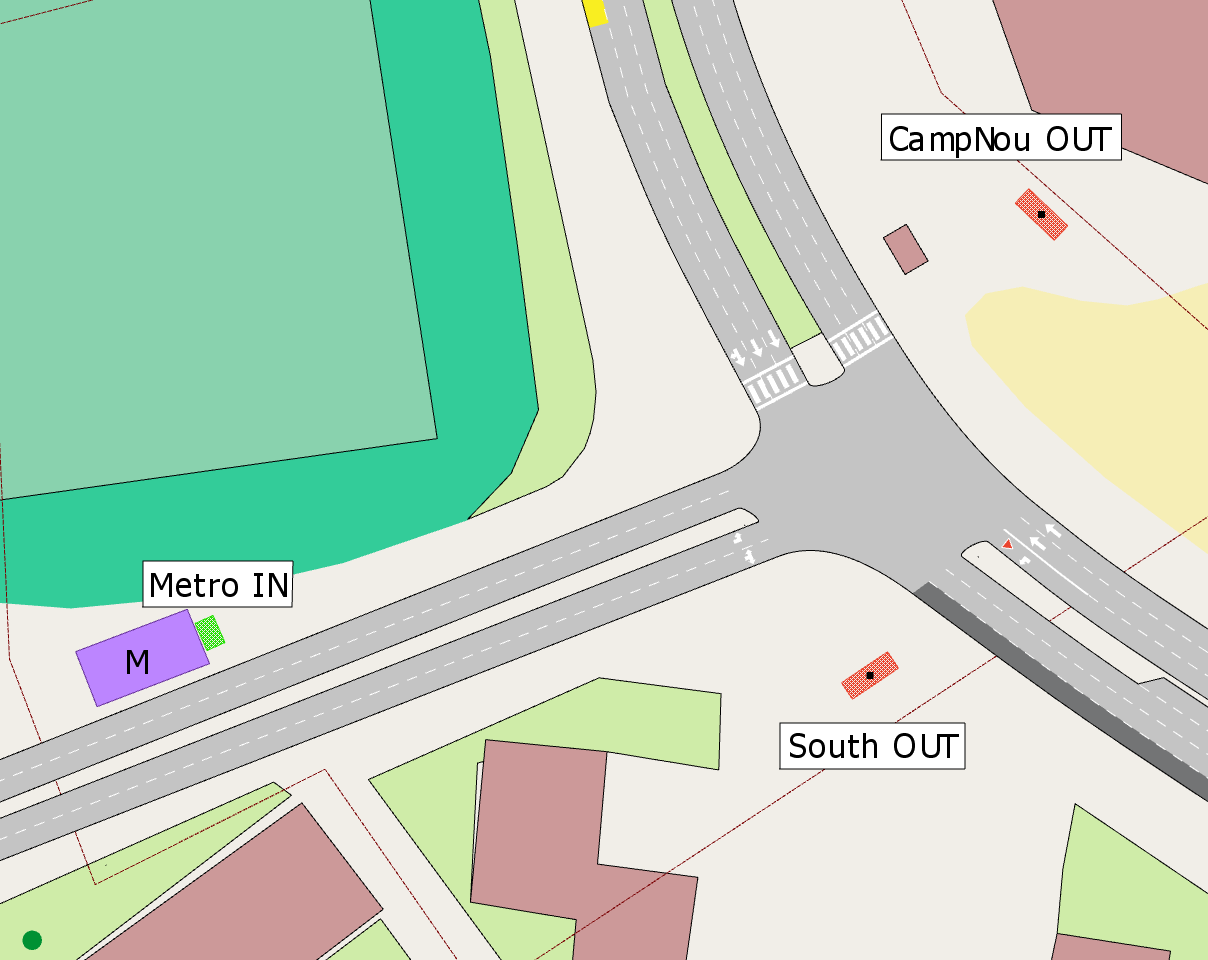
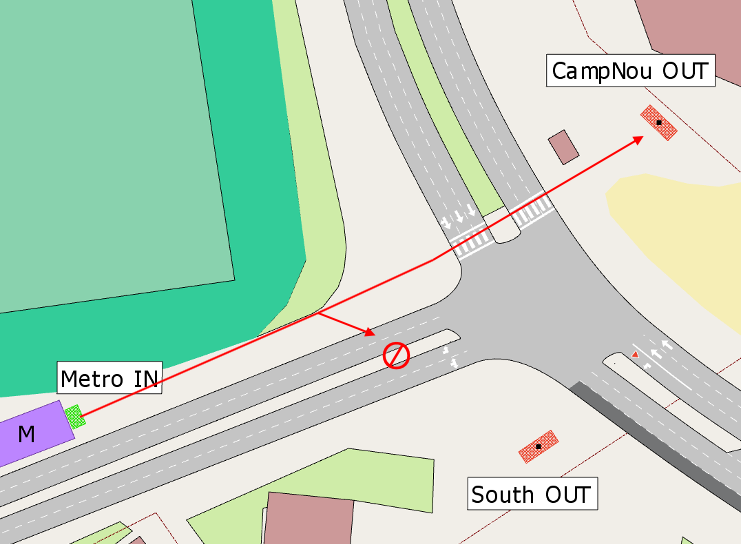
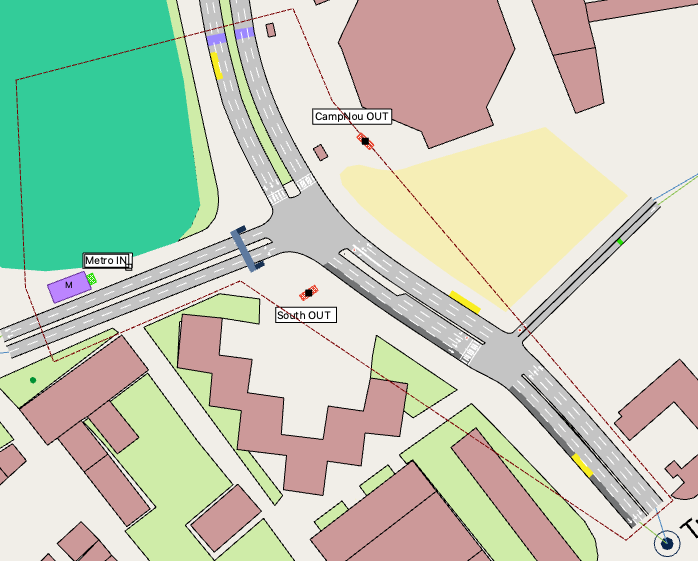
When adding these objects, use the screenshot below as a guide.
-
Right-click Centroids > Activate. The layer icon turns blue to indicate that this is now the active layer.
-
Click the Pedestrian Entrance icon
and draw the pedestrian entrance in the 2D view. The entrance is a rectangle which you can size and rotate as required.When you add a pedestrian entrance to the network, a pedestrian centroid configuration is added to the Project folder.
-
Double-click the Pedestrian Exit icon
and draw both pedestrian exits in the same manner as step 2. Tip: when you double-click a tool icon it remains the active tool until you press Esc or select another tool.
If you need to move, resize, or rotate entrances and exits later, click to select and then drag to move; use their resizing handles to increase or decrease area. To rotate, click the Rotate icon
 and then click on the object to change its orientation.
 -
Rename the entrance Metro IN and rename the exits CampNou OUT and South OUT, as indicated in the screenshot above.
Exercise 4. Adding a Pedestrian Type
Now we have an area for pedestrians to enter, walk through, and exit, we need some pedestrians. In this exercise we will add a pedestrian type.
To add a pedestrian type:
-
Select Project > New > Pedestrians > Pedestrian Type.
A new Pedestrian Type is added to the Project folder.
-
Open the Pedestrian Type to check the default parameters.
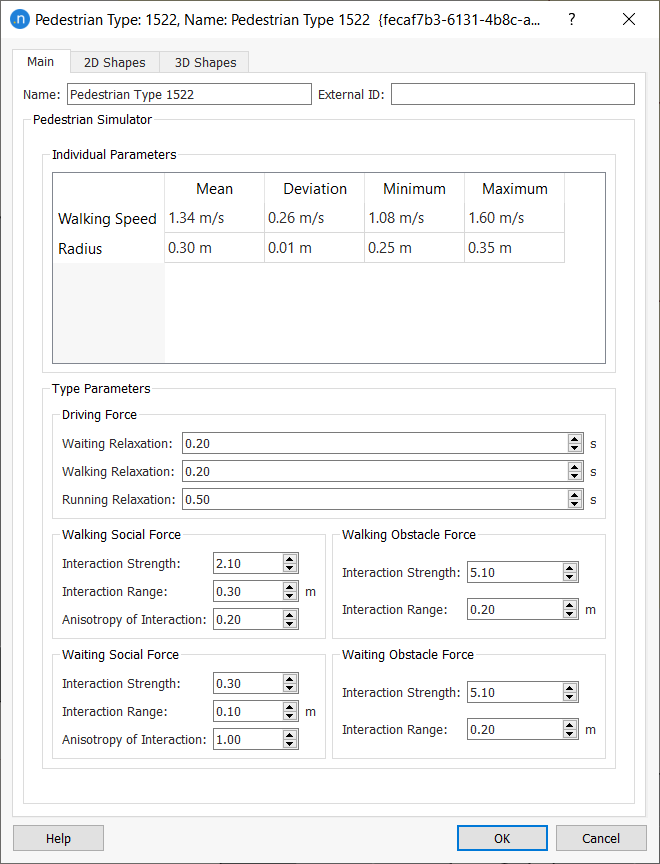
The Pedestrian Simulator parameters specify the walking speed and radius of the pedestrian entities. The Type Parameters contain the parameters of the social-force model for pedestrian dynamics and are described elsewhere in Pedestrian Types.
-
Keep the default settings and click on the 3D Shapes tab. We will add the 3D figures for the simulated pedestrians next.
-
Click Add.
-
Double-click in the Shape cell and select pedestrian_female.osg.
-
Repeat steps 4 and 5 to add pedestrian_male.osg and pedestrian_child.osg.
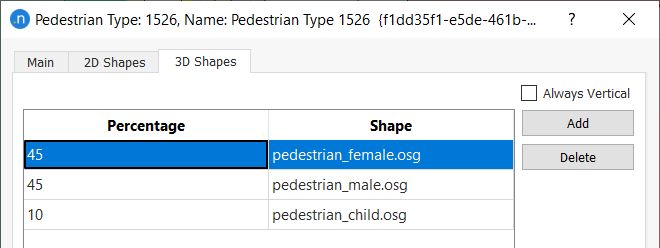
To view the 3D animations of pedestrians, scroll to the bottom of the Pedestrian Type dialog.
-
Enter Percentage values to total 100.
-
Click OK.
Exercise 5. Creating an OD Matrix
Now that we have a pedestrian entrance and two exits, we can create an OD matrix to introduce pedestrian demand.
To create an OD matrix:
-
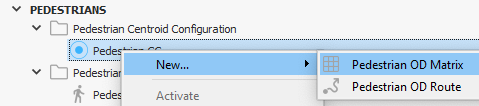
Rename the Pedestrian Centroid Configuration as Pedestrian CC.
-
Right-click Pedestrian CC > New > Pedestrian OD Matrix.
-
Open the new OD matrix.
-
On the Main tab, enter an Initial Time of 08:00:00.
-
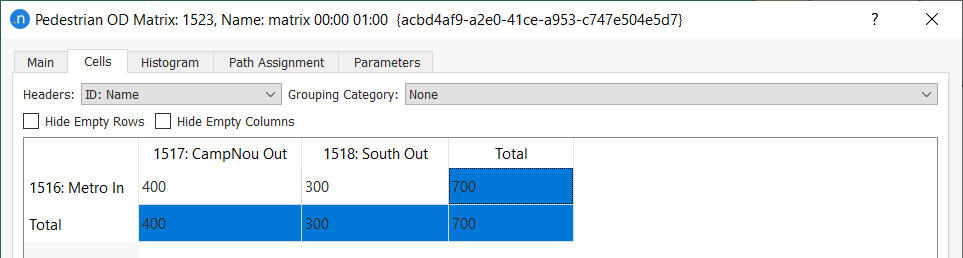
Click the Cells tab.
-
Enter the matrix data using the values shown below.
Pedestrians will take the shortest path between their origin and destination, taking roads, pedestrian crossings, and obstacles into consideration. If you require new or existing elements to act as obstacles to pedestrians, select the element and right-click Generate Pedestrian Obstacle.
Exercise 6. Changing the Level (via Bridge)
The shortest path between Metro IN and CampNou OUT takes pedestrians over an available crossing, but there is no available path between Metro IN and South OUT.
In this exercise we will create an accessible path by adding a level-change element in the form of a bridge.
To change the level:
-
Right-click the Bridges layer and select Activate.
-
Click the Create Level Change Object icon
 .
. -
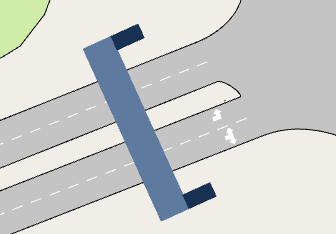
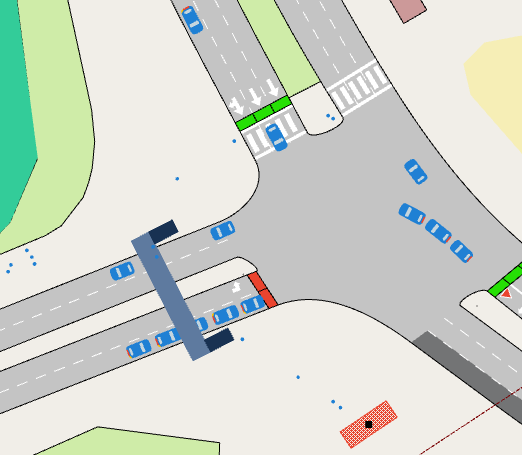
Draw the object pictured below across the two road sections near South OUT. You can resize, move, and rotate it as desired. At the moment it appears underneath the sections. We will fix this in the next step.
-
Open the Pedestrians Layer and change Level to 150.
-
Click OK. This raises the whole pedestrian area above the sections, meaning the bridge now crosses over the sections.
-
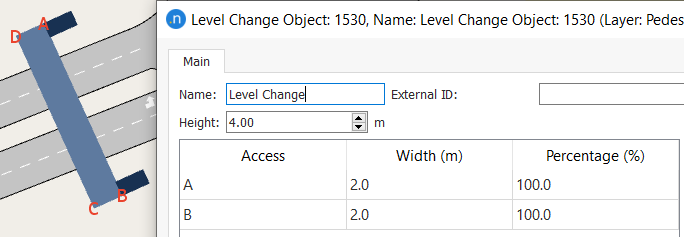
Double-click on the bridge object and rename it Level Change.
-
Set Height as 4.00 m and for both access points (A and B) set the Percentage as 100%. The reason this is 100% is because there is only one access point at each side of the bridge.
-
Click OK.
Exercise 7. Viewing Traffic Control
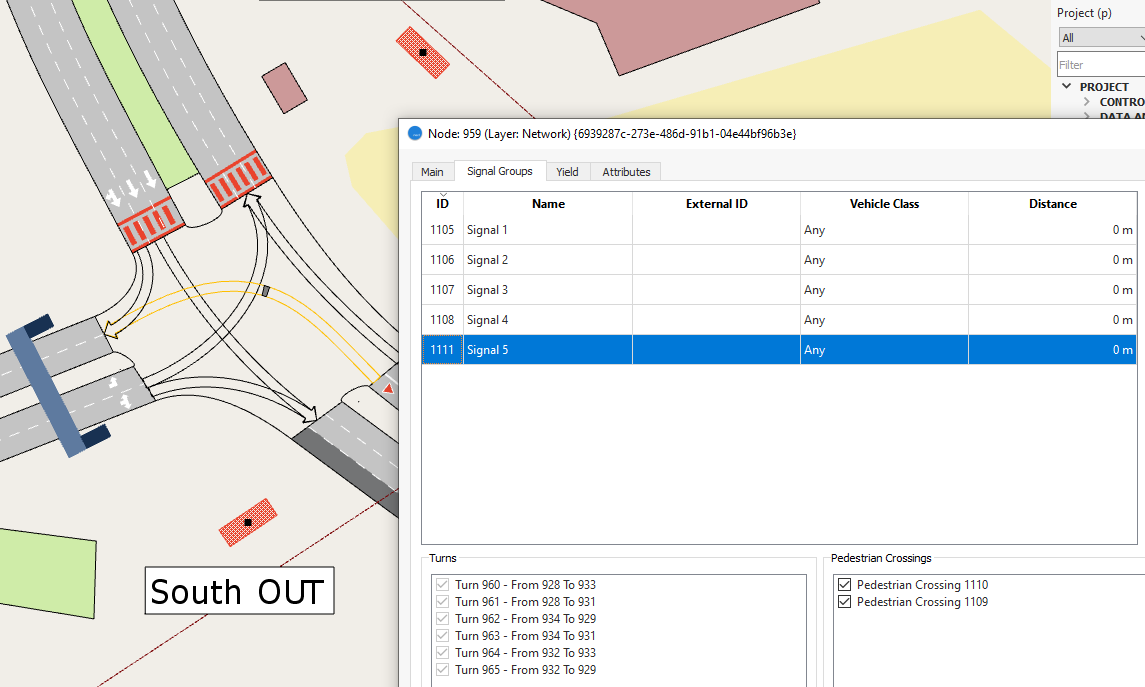
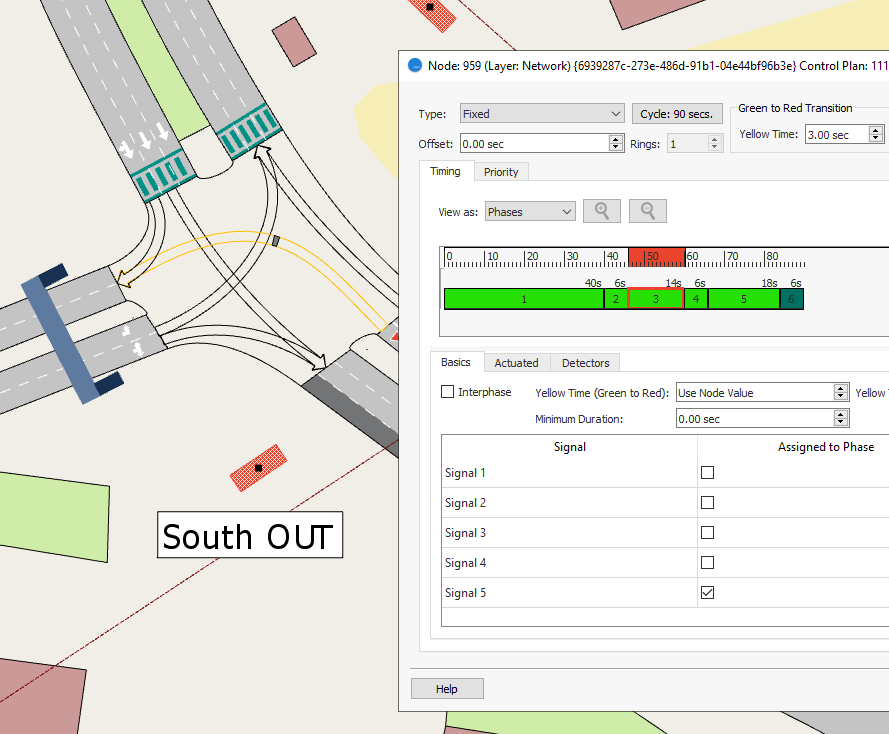
You might recall from earlier tutorials that Node 959 already has signal groups, with Signal 5 linked to the pedestrian crossings. This signal will affect the new simulated pedestrians.
To view traffic control:
-
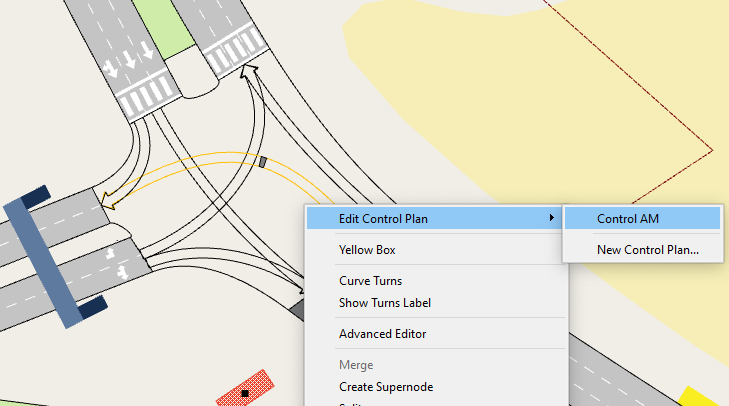
Click on Node 959 to select it and then right-click Edit Control Plan > Control AM.
Phases 3 and 4 operate Signal 5 and allow pedestrians 14 + 6 seconds of green crossing time.
Exercise 8. Running the Simulation
We can now run the simulation, including the new pedestrian-related features. To do so, we need to include the pedestrian data.
To run the simulation:
-
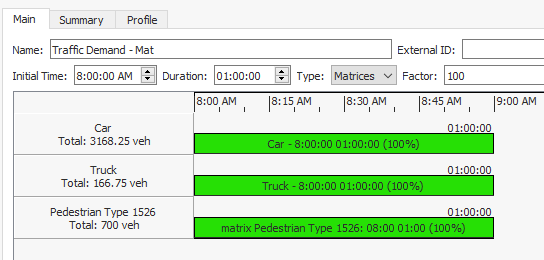
Open Traffic Demand – Mat.
-
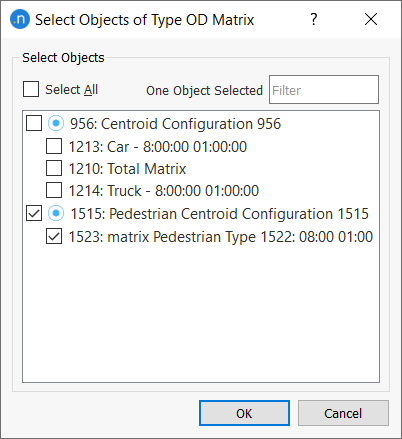
Click Add Demand Item and tick Pedestrian Centroid Configuration to add the pedestrian demand.
-
Click OK to add the demand to the dialog.
-
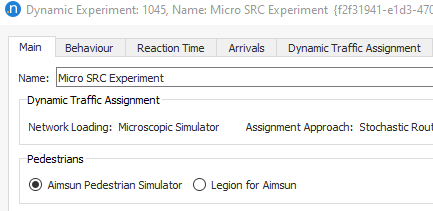
Open Micro SRC Experiment and select Legion for Aimsun.
-
Right-click Replication > Run Animated Simulation (Autorun).
-
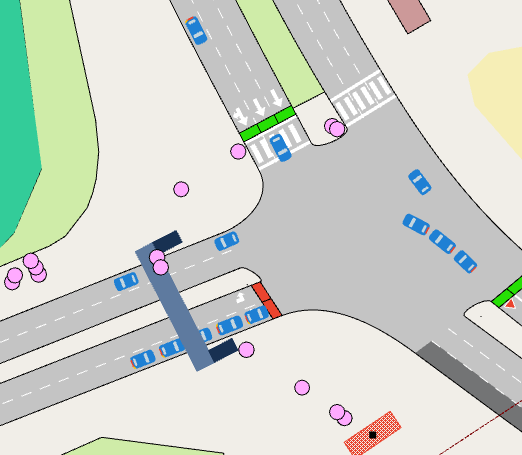
Select the view mode Pedestrians to make it easier to observe the simulated pedestrians. This view increases their size, as shown below.
Exercise 9. Including Transit Choices
In this exercise, we will enable pedestrians to choose between walking all the way to their destination or using transit for part of their journey (e.g. walk > bus > walk). To do so we will activate a parameter called Dynamic Transit Assignment.
To do so, we first need to extend the pedestrian area and include a new destination for the pedestrians to journey to. The extended area is shown below.
9.1 Including transit choices
To extend the area:
-
Open the Pedestrians Layer and tick Allow Object Editing.
-
Click and drag the vertices of the pedestrian area to extend it as illustrated above. To add extra straight vertices to the polygon, click
 and drag a line across a segment of the pedestrian area.
 -
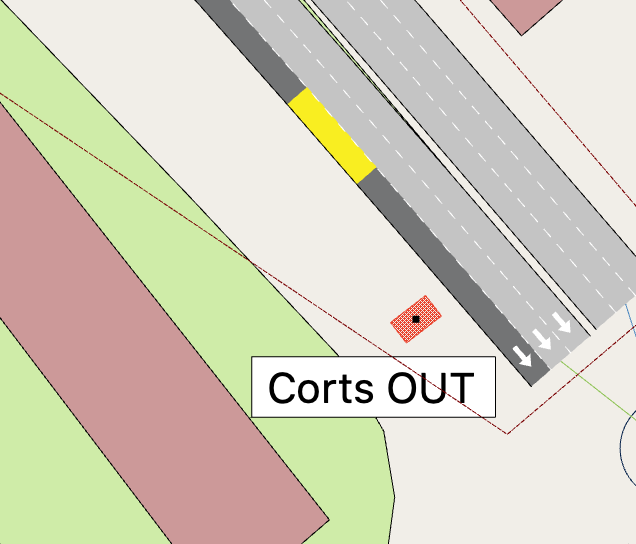
Add a new pedestrian exit near to the end of the southern part of the pedestrian area.
-
Rename it Corts OUT.
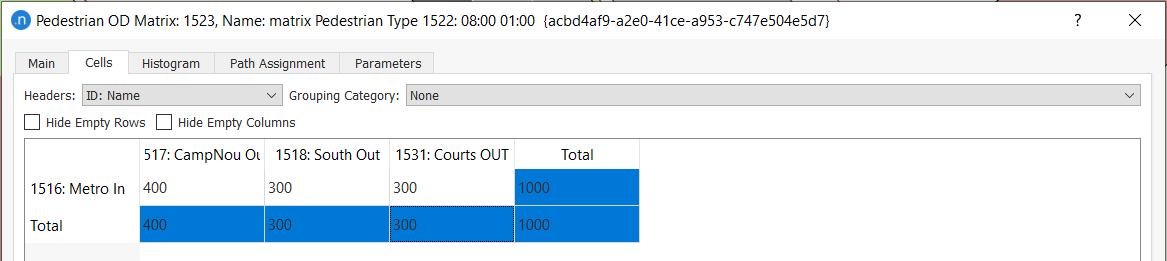
-
Open the pedestrian OD matrix and add data for the new destination, as shown below.
-
Open Micro SRC Experiment and click the Behavior tab.
-
In the Pedestrians group box, tick Dynamic Transit Assignment.
-
Right-click Replication > Run Animated Simulation (Autorun).
-
Optional: If you want pedestrians to avoid the greenery, ensure that the OpenStreetMap layer can be edited (Allow Object Editing) and then right-click on the greenery and select Generate Pedestrian Obstacle.
Tip: You might need to disable editing again if you want to click on other objects, like vehicles or bus stops.
9.2 Checking and adjusting bus capacity
The maximum capacity of a bus is defined in the Vehicle Type dialog. Vehicle types can be found in the Project folder, within Vehicles.
To check and adjust bus capacity:
-
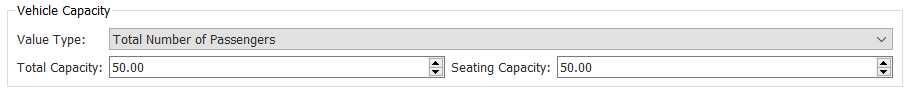
In the Vehicles folder, double-click Bus to display its Vehicle Type dialog.
The maximum number of passengers is 50.
-
To check the number of passengers on a bus, in the 2D view, click on a simulated bus to open its dialog.
-
Click the Dynamic Attributes tab.

-
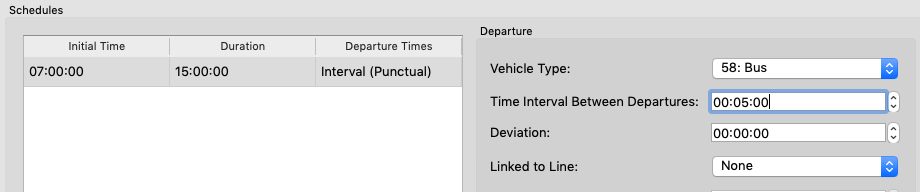
Optional: If you want to increase the proportion of pedestrians taking the bus, reduce its costs, for example by increasing the frequency of the L-Blue transit line. To do so:
i. Open the transit line L-Blue and click the Timetables tab.
ii. Click on a schedule and lower the value for Time Interval Between Departures.
Exercise 10. Creating a View Mode
In this concluding exercise, we will create a new view mode to highlight pedestrians based on their destinations. You might like to refer back to the view mode exercises in the tutorial Viewing Microsimulation Outputs.
To create a new view mode:
-
In the Project folder, right-click View Modes > New View Mode.
-
Rename the new view mode Pedestrian Destinations.
-
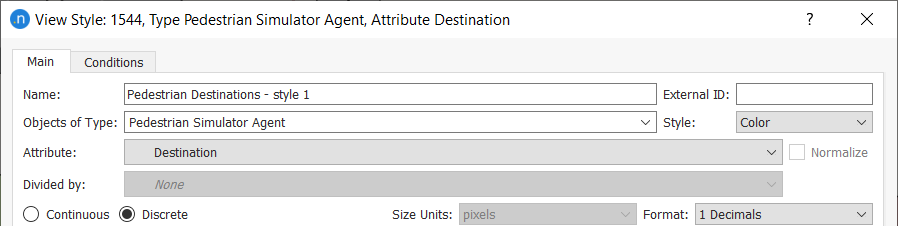
Open Pedestrian Destinations and click Add New Style.
-
For Objects of Type, select Pedestrian Simulator Agent.
-
For Attribute, select Destination.
-
Select the option Discrete.
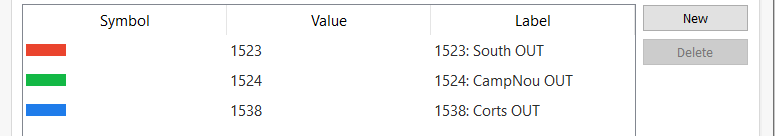
-
Add value ranges to represent the three pedestrian destinations/exits in the network and choose a color ramp based on your preference.
-
Right-click Replication > Run Animated Simulation (Autorun) and select the new view mode.