Printing
The Print Layout feature is used to compose a graphic layout on a page, including elements such as views of the network, legends, text, time series graphs, or images. These can then be printed or exported to a PDF or an image.
Print Layouts are re-usable templates which ensure consistency in the views of the different parts of the network.
Print layouts are stored in the Data Analysis folder in the Project window. To create a new Print Layout, right-click on the Data Analysis folder in the Project window, and choose *New > Print Layout; to edit it, double-click on it in the Project window.
One of the Print Layouts created can be defined as the default one. This will be the one used when going to File : Print.
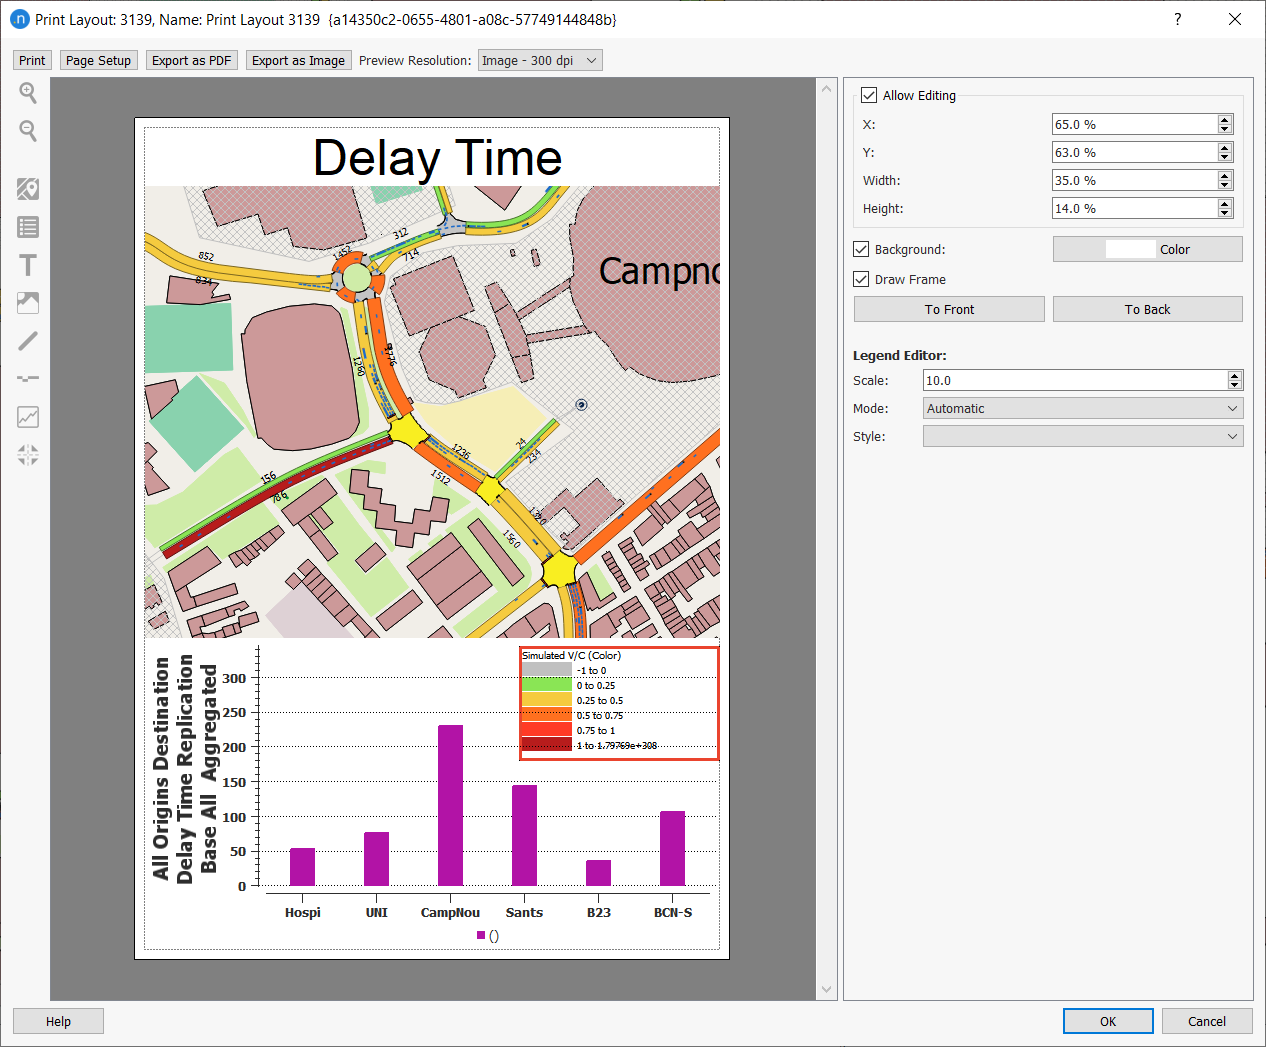
Print Layout Editor
The Print Layout editor adds and removes elements to the layout, configures the specific parameters of each element, changes the page format, and prints or exports the Print Layout to PDF or an image file.
Adding and removing elements
To create a new element, click on one of the buttons in the left tool bar. The corresponding new element will be added around the center of the Print Layout.
New elements can also be created using the Copy-Paste keyboard standard shortcuts: select some elements and trigger the copy shortcut (Ctrl+C on Windows); then trigger the paste shortcut (Ctrl+V on Windows) to create clones of the items.
To remove an element, select it, when it will be highlighted in red, and press the delete key.
The center of the Print Layout editor, shows a preview of the Print Layout. Use the zoom in/out buttons in the top tool bar, or the standard keyboard shortcuts for zooming in/out (Ctrl+Plus and Ctrl+Minus on Windows), to zoom in/out of the preview.
The elements that can be added are:
- Map
 Adds a 2D map view.
 - Legend
 Includes the Legend window appropriate to the view
 - Text
 Adds a text box with options for tagged text.
 - Image
 Adds an image from a file.
 - Lines
 Adds a single line.
 - Scale
 Adds a scale rule similar to the one visible in the 2D view window.
 - Timeseries
 Adds a time-series graph. Typically this will show data related to the view in the map element.
 - Node
 Adds a view of a specified node.
Configuring the elements
To configure an element, select it by clicking on it (several elements can be selected at a time with Ctrl+click or by sweeping out an area with the mouse). The attributes are displayed in the editor at the right side of the preview.
General attributes. All the elements have those attributes in common:
- X,Y, Width and Height: they are expressed in % of the page and allows to define the position and size of an element. You can move the selected elements by drag & drop, and resize them by moving their edges. You can also move the selected elements by 1% increments using the keyboard arrows.
- Background: check it to draw an opaque background for the element, and define its color with the Color button.
- Draw frame: check it to draw a black frame at the border of the element.
- Z-ordering: click on 'To front' or 'To back' to bring the element to the foreground or send it to the background.
The specific attributes are:
-
Map:
- Scale to zoom in and out of the view and also to provide a means of choosing a pre-determined scale, which can be made consistent across uses of the map view.
- Move to: To move to a bookmarked view.
- Use Active View Setup: An option to use the view in the active window or to use a customized view in printing.
- Mode: to define the View Mode to be used on the view.
- Experiment: To select a source for the data used in the View Mode if a mode other than "none" is selected.
- Aggregation: The method used when displaying data, the options are the default from the view or to use the mean, sum, minimum, or maximum.
-
Legend:
- Scale: changes the size of the font of the legend's items.
- Mode: defines the mode to be shown by the legend. If the legend element is above a map element, leave it to 'Automatic' and the legend will use the mode defined in the map element.
- Style: defines the style to be shown by the legend, or shows all the mode's styles if set to 'All'. Note that by default, the selected style is the first color style of the mode.
-
Scale
- The scale element will display the scale used by the map element below it. If the scale is not above a map element, it will show the scale of the closest map element.
- Show Scale Label: Shows the scale value in "1:xxxx" format.
-
Time Series graph
- This element displays Time Series graphs in the same way as the Time Series Viewer.
- To add Time Series to the graph, a widget similar to the Time Series Viewer appears when the timer series is selected. This adds Time Series to the graph and configures them. Refer to the Time Series Viewer Section for more details on setting up Time Series.
-
Text
-
The text of the text element supports special variables, that are automatically replaced by the corresponding value:
- ${A_AUTHOR}: author of the document
- ${A_VERSION}: Aimsun Next version
- ${A_PATH}: document path (file name not included)
- ${A_FILE_NAME}: document file name
- ${A_VIEW_CONTEXT}: underneath view's context
- ${A_VIEW_CONTEXT_NO_DATE}: underneath view's context without date
- ${A_DATE}: current date
- ${A_TIME}: current time
- ${A_DATE_ISO}: current date in ISO format
- ${A_TIME_ISO}: current time in ISO format
- ${A_TIMESERIES_GRAPH_TITLE}: underneath Time Series graph's title
-
The font, font size, color, and alignment of the text can also be configured.
-
-
Image
- Click the 'Browse' button, to choose the image file to be shown.
-
Line
- The line element draws vertical, horizontal, and diagonal lines. The color of the line is always black.
-
Node
- The Node ID is used to specify which node is to be displayed.
- The turn labels are use to specify the data, and the source of the data to be displayed.
Configure the page format
To change the page format, click on the 'Page Format' button in the top tool bar. This brings up a page format dialog to select page size, orientation, and margins.
Printing and exporting the print layout
You can print a print layout and also export it as a PDF or an image file (we use PNG files). You can do this from the Print Layout dialog and also from the Project window's context menu. The context menu enables you to print or export multiple print layouts whereas the dialog only handles single print layout.
The dialog and context menu work in slightly different ways as described below.
From the dialog
Click one of the three buttons at the top-left of the dialog:
- Print: this will open your current active printer dialog where you can set your preferences and proceed.
- Export as PDF: in the Export PDF dialog, navigate to a folder and enter a File name for your PDF.
- Export as Image: in the Export Image dialog, navigate to a folder and enter a File name for your PNG file. The pixel size of the image will be four times bigger than the defined size of the layout in points (e.g. a width of 500 points results in a width of 2,000 pixels). Margins of the page are not included in the image.
From the Project window
In the Project window, select one or more print layout objects. Right-click on the selected print layout(s) and select one of the following options:
- Print: this will open your current active printer dialog where you can set your preferences and proceed. If you selected multiple print layouts, the printer dialog will be displayed for each selected layout.
- Export as PDF: in the Select Output folder, navigate to a folder and click Select Folder where your print layout(s) will be saved as PDFs.
- Export as Image: in the Select Output folder, navigate to a folder and click Select Folder where your print layout(s) will be saved as PNG files. The pixel size of the image will be four times bigger than the defined size of the layout in points (e.g. a width of 500 points results in a width of 2,000 pixels). Margins of the page are not included in the image.