Animated Outputs
Aimsun Next provides a visualization of individual vehicles moving on the road network in both 2D and 3D when an animated simulation is running. This visualization is invaluable in debugging models during calibration and validation and in presenting the outputs of the model.
Refer to the Running the Simulation topic for details about running a simulation and controlling it using the task bar. Also, refer to the View Mode and Dynamic Labels topics for details about how to modify the representation of the map, the vehicles within it, and the annotation.
2D Views 
A microsimulation model shows vehicles moving on a 2D map. This view is useful for debugging vehicle behavior such as queueing, lane choice, and movement over nodes, etc. It is also useful for conveying information to transport-planning decision makers about the traffic in the network, the movement of vehicles, and any congestion experienced.
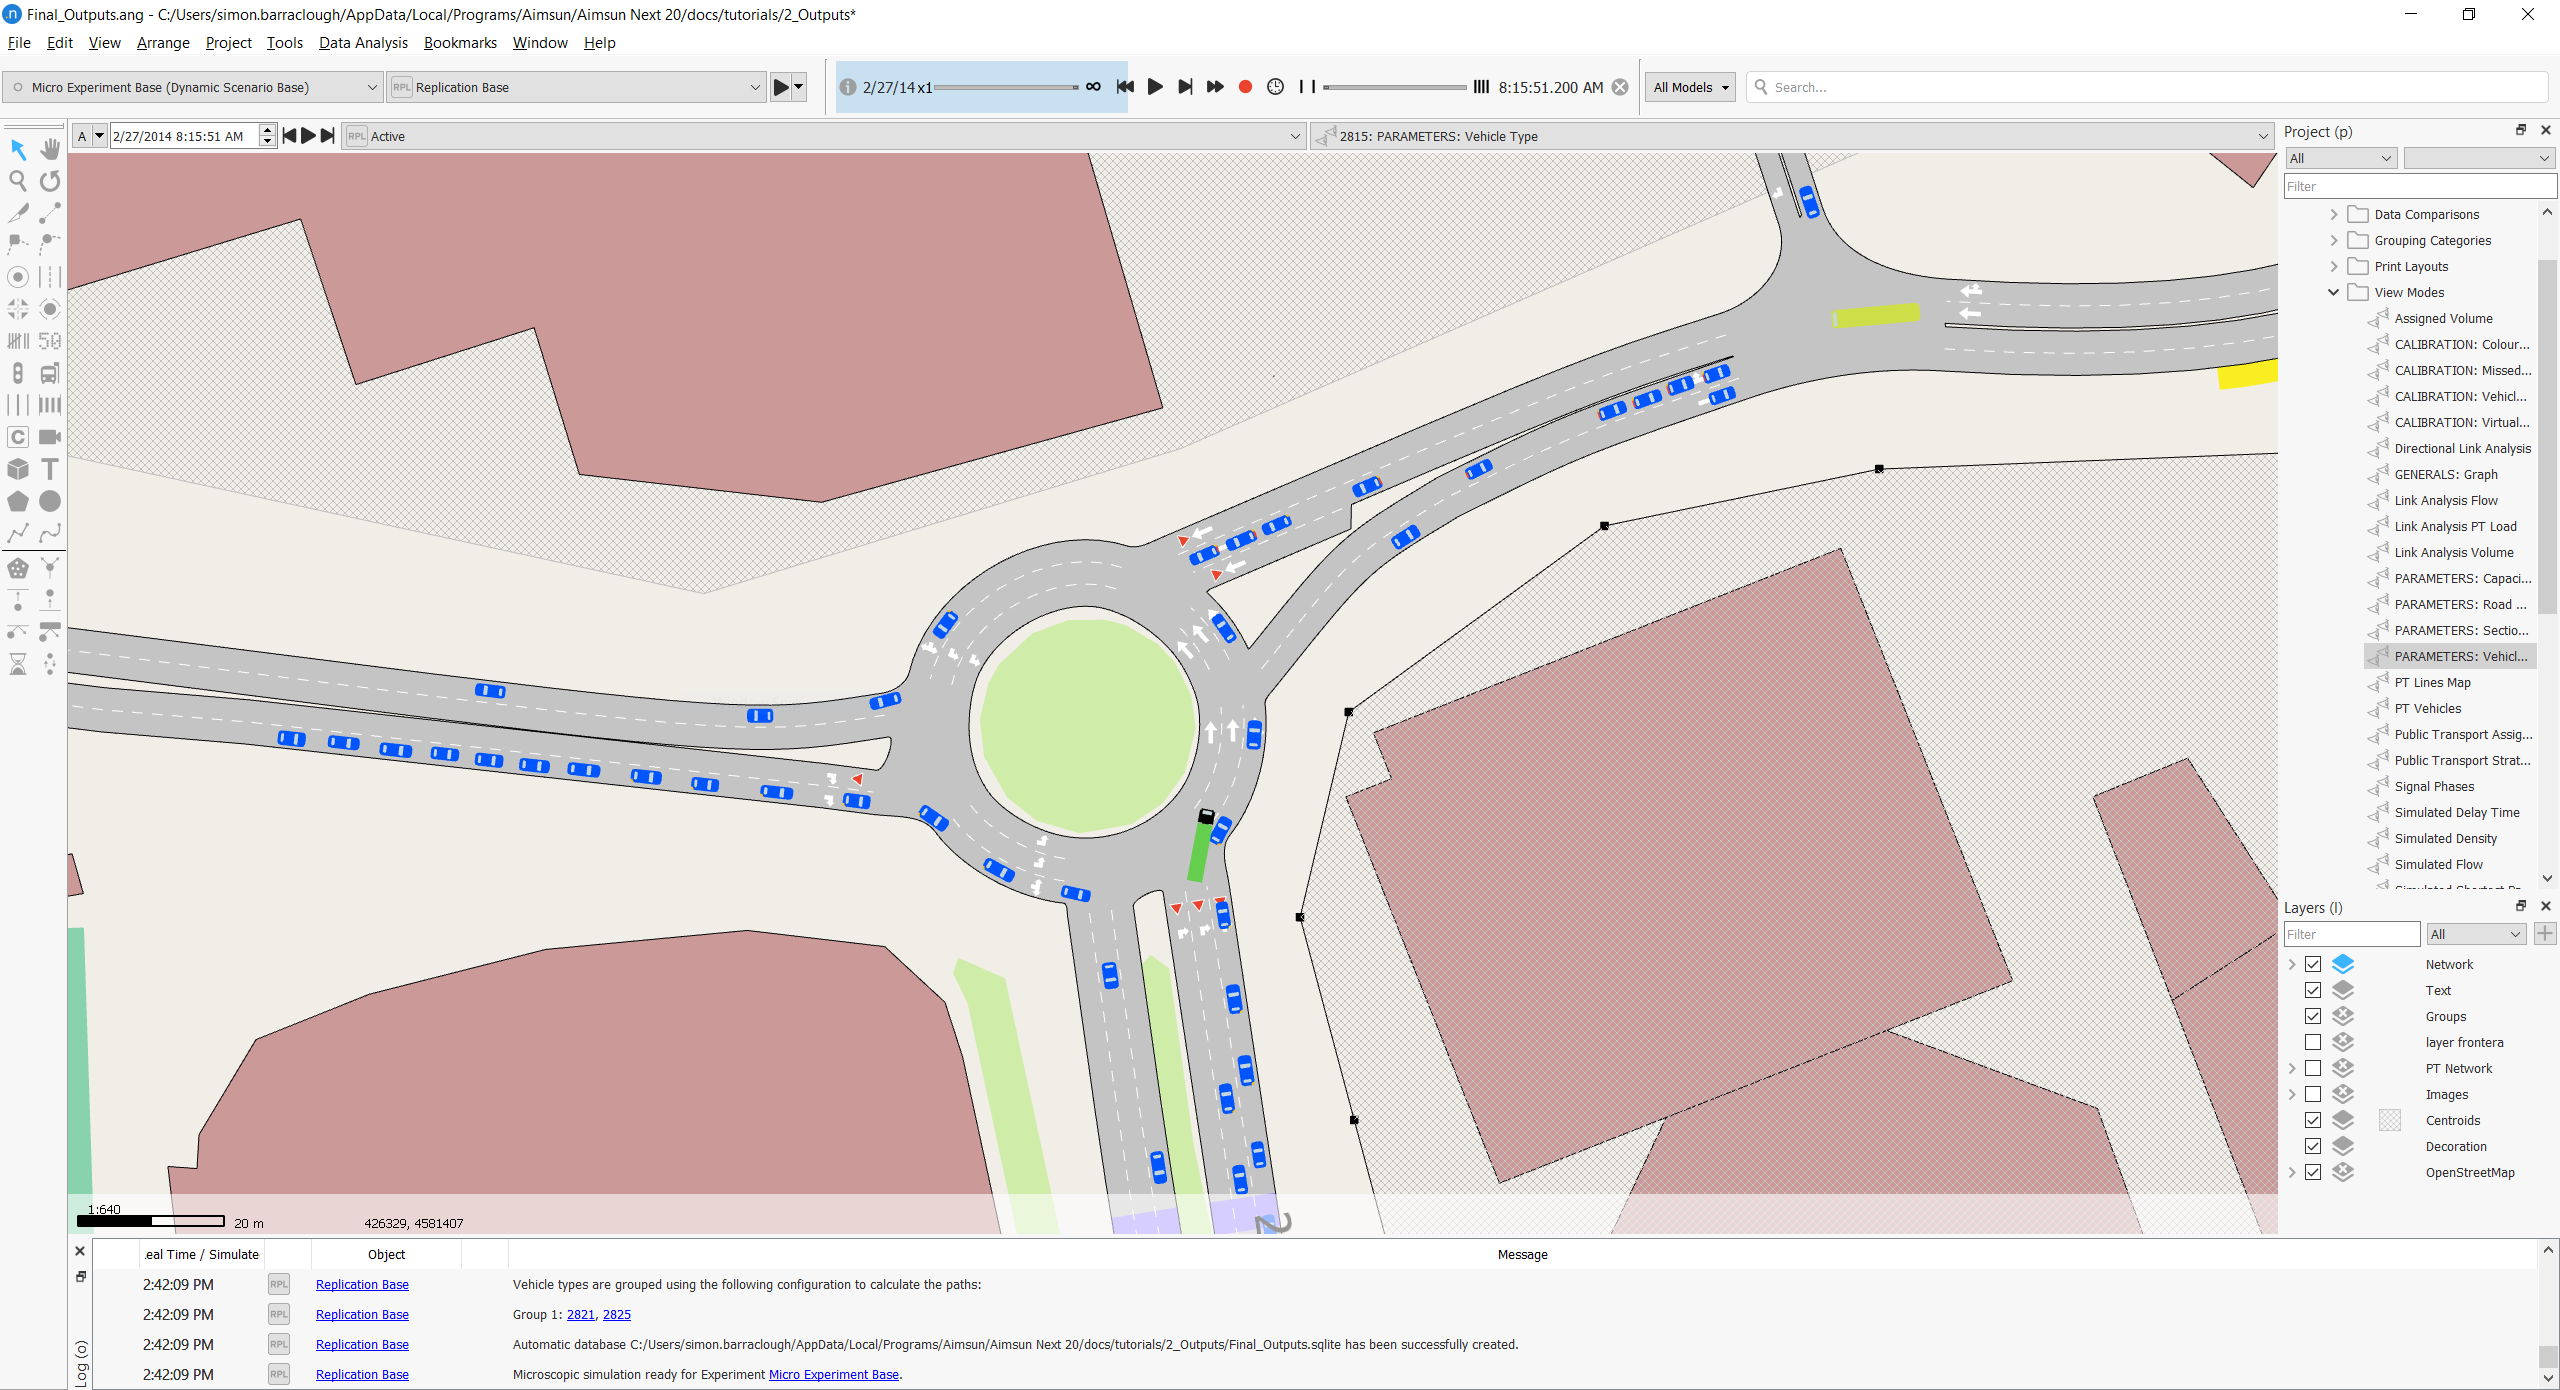
The view can be recorded as a video file to be played back using any available delivery system (file sharing, YouTube, etc.). Refer to the Recording a Video File topic for details on recording the video and to Preferences Editing for how to format the video file. The simulation can also be recorded and replayed in Aimsun Next with the option to move the viewpoint and also step forwards and backwards in the video. See Recording and Replaying the Simulation for details.
The view can also be copied to the system clipboard using the Copy Snapshot option in the view context menu.
The appearance of vehicles in the 2D map is set using the Vehicle Type Editor. This controls the shape of vehicles (Car, Bus, Truck, Van, Bike, Pedestrian, Box, and Circle) or the articulated parts of the vehicle, if any. It also includes display indicators when vehicles decide to turn or change lane, and brake lights that are illuminated when the vehicle brakes.
Vehicle Attributes
When a simulation is paused, detailed information about a particular vehicle is available by double-clicking on it. The Simulation Vehicle dialog for the selected vehicle is displayed (see the screenshot below).
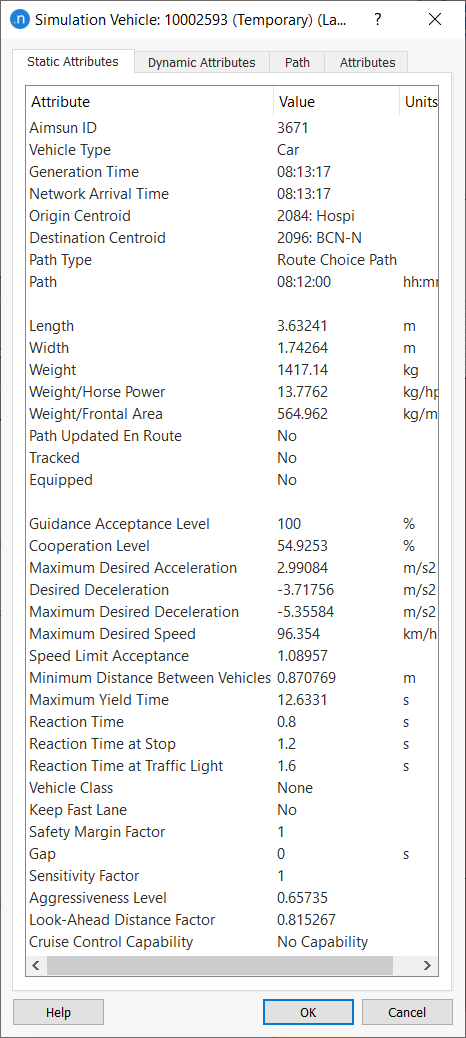
When the model is restarted, the dynamic information in this dialog is continuously updated until the vehicle exits the network or the dialog is closed. Multiple vehicle dialogs can be opened simultaneously.
The Simulation Vehicle dialog provides two types of information about the vehicle: Static Attributes and Dynamic Attributes.
The Static Attributes tab shows the vehicle identifier, vehicle type, and vehicle class, as well as whether the vehicle is guided or not, tracked or not, equipped or not, and the guidance acceptance level. The origin and destination centroids, destination section, and the path tree being used are given when running in route-based mode.
Other vehicle static data provided are length, width, acceleration and deceleration rates, vehicle desired speed, speed limit acceptance, minimum distance to keep from previous vehicle, maximum yield time, reaction time, and reaction time at stop. See Vehicle Modelling Parameters Section for a description of these parameters.
The Dynamic Attributes tab shows the current and previous speed, desired speed, and position. Floating car data can also be obtained from this tab by ticking the Get Floating Vehicle Data checkbox. The distance travelled, the time being followed, the mean speed, the number of stops, and the total stop time of the floating car are displayed in the dialog and continuously updated while the simulation runs. This continues until the vehicle exits the network or the dialog is closed.
To check on vehicle behavior during car-following in CAV applications like platooning or queue dissipation on connected signalized intersections, the following attributes are also displayed:
- Headway to the Leader: The time (in seconds) between the front bumper of the vehicle and the front bumper of the vehicle driving in front of it.
- Gap to the Leader: The time (in seconds) between the rear bumper of a vehicle and the front bumper of the following vehicle.
- Spacing to the Leader: The space (in meters or feet) between the front bumper of a vehicle and the front bumper of the following vehicle.
- Clearance to the Leader: The space (in meters or feet) between the rear bumper of a vehicle and the front bumper of the following vehicle
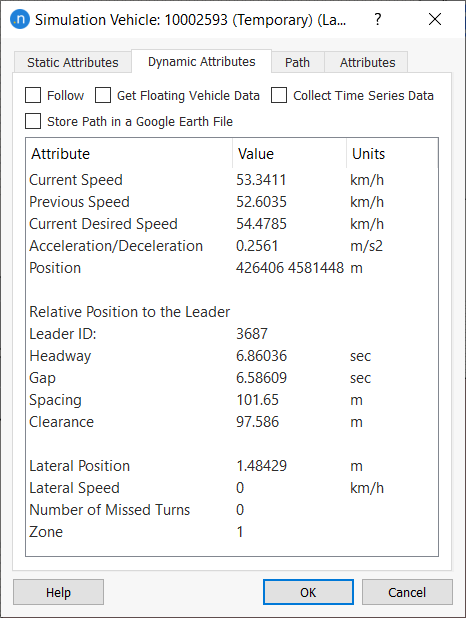
The Follow checkbox tracks the vehicle using an automatic, continuous scrolling network view.
The Store Path in a Google Earth File checkbox saves the path of the car in a KML file that is readable by Google Earth. The path recording ends when any of the following events occur: the button is unchecked, the simulation vehicle dialog is closed, the simulation ends, or the vehicle leaves the network. To get a correct path it is necessary to have the correct UTM zone defined in each of the layers of the network as well as having correct coordinates in the network geometry.
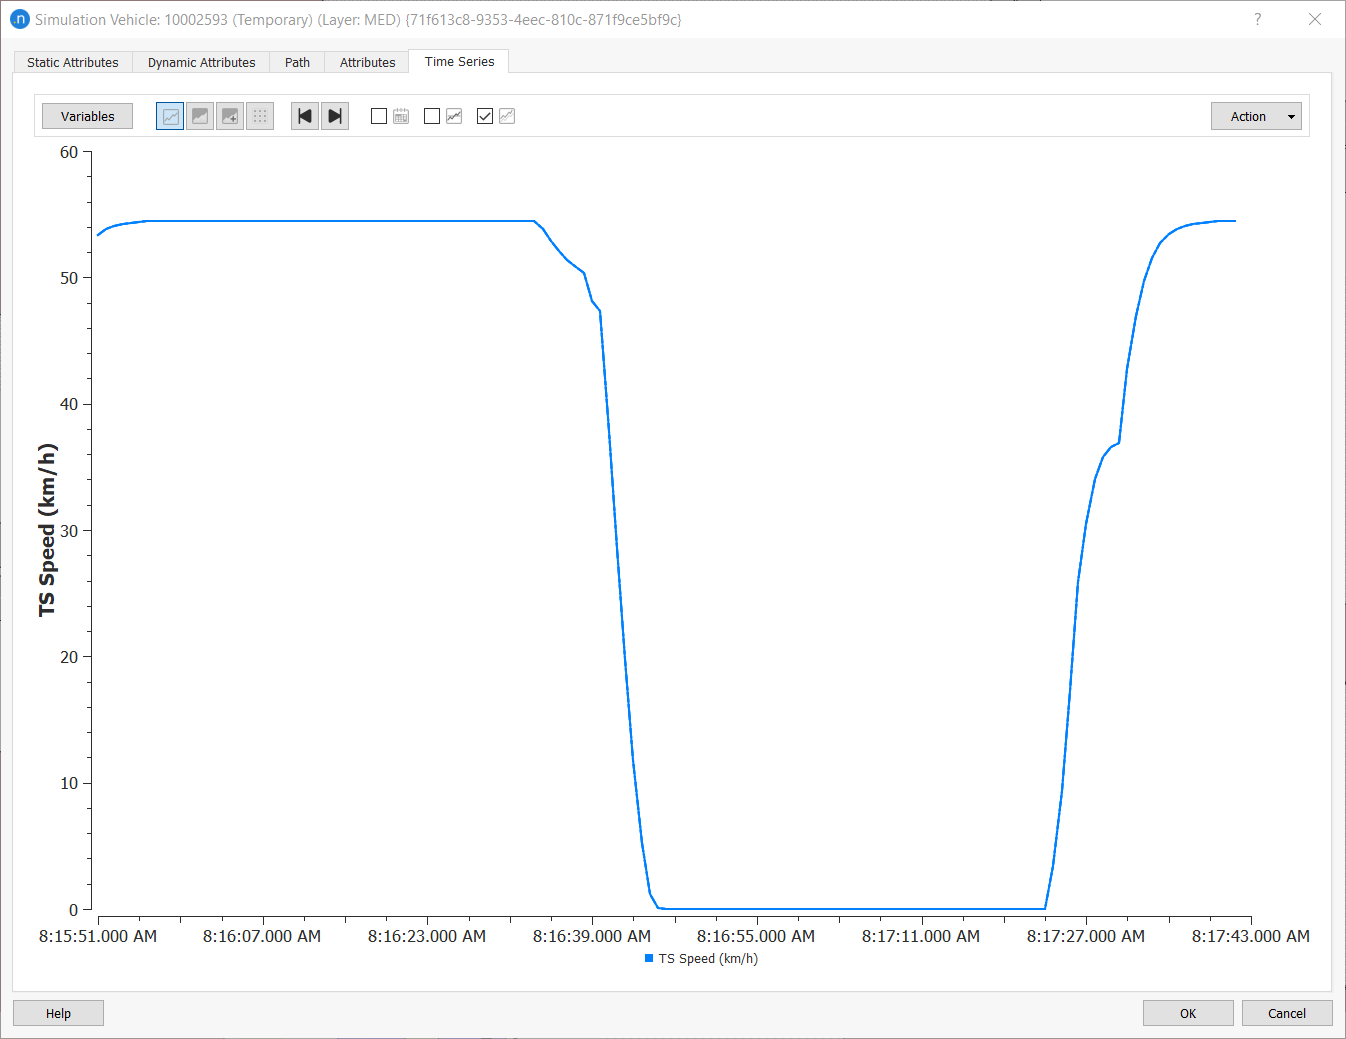
The Collect Time Series Data checkbox adds a new Time Series tab to the dialog where the distance travelled by the vehicle, the speed at each simulation step, and acceleration can be seen on the Time Series tab while the vehicle is in the model. This option can also be switched on and off in the vehicle's right-click menu.
When simulating using OD matrices, a Path tab is also available. On this tab, the sections composing the path (Initial or Current Path, or Next Sections in Path) are listed together with the cumulated Cost, Travel Time, and Distance from the beginning of the path to the section, as well as the values for the complete path. The path can be drawn in the active 2D view and a color selected for drawing the path.

When simulating using traffic states, the Path tab will only show the next sections in the path.
Transit Vehicles and Routes
You can view detailed information about a particular transit vehicle by double-clicking on it while the simulation is paused. The Simulation Transit Vehicle dialog is displayed and the vehicle will be marked as selected. The transit line that the vehicle belongs to is also identified.
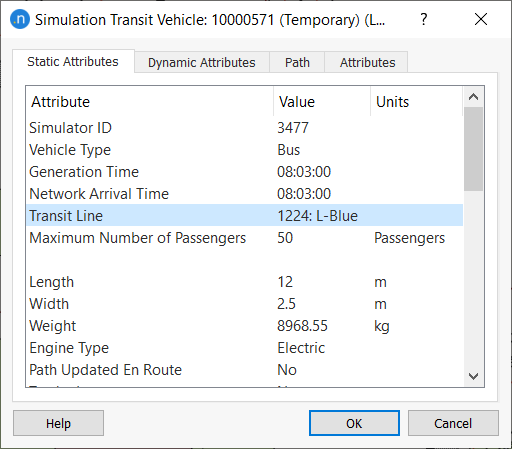
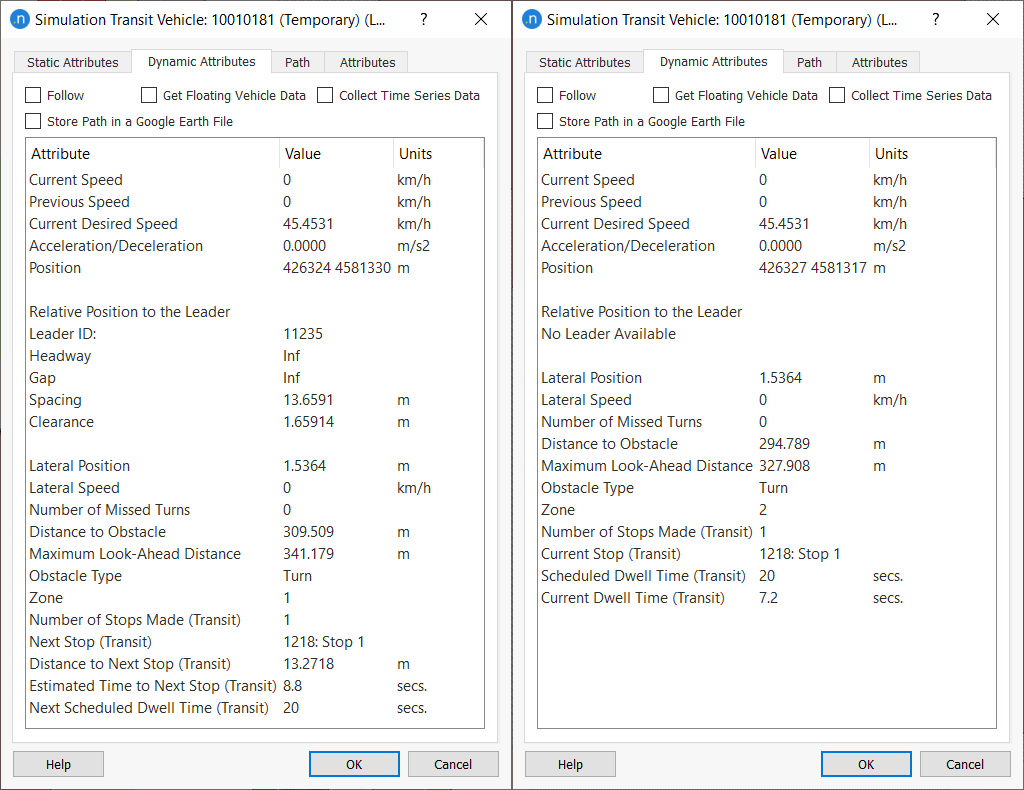
On the Dynamic Attributes tab, the information varies according to the state of the vehicle: whether it is at a stop, approaching a stop, or has made its final stop:
- Number of stops that the vehicle has made since departure.
- Identifier of the next stop.
- Distance to the next stop (in meters) if it is scheduled to stop again.
- Next scheduled dwell time, the time of service at the next stop (in seconds). This is calculated from the normal distribution defined in the relevant transit line timetable.
- Current dwell time if the vehicle is at a stop.
Graphical Timetable
The Graphical Timetable tab is part of the Transit Plan dialog. In the Free Flow mode, the estimated space–time graph for each transit vehicle assigned to a line is shown, including the running time and stopping time. In the Simulated mode, the same graph is shown but uses data from the transit vehicles in the simulation. In the Free Flow & Simulated mode, both trajectories are shown simultaneously and can be used to compare the estimated and achieved times for the vehicles. The example below shows where delays are incurred between stops and where vehicles fall behind the free-flow timetable.
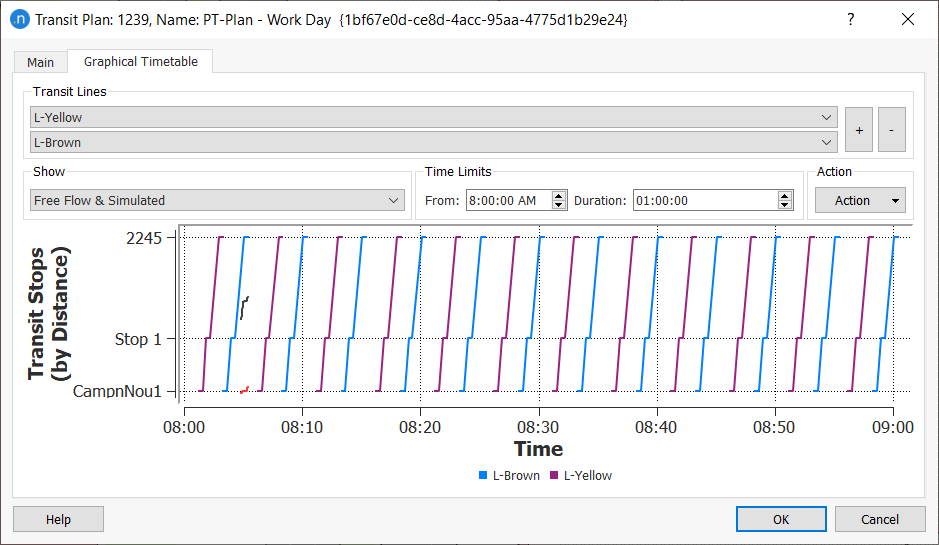
If they have a common route for at least two stops, different lines running along the same stretch can be visualized in the same graph, allowing comparison (only the common part of the route will be shown). This can be useful when coordinating different lines in a corridor.
Time limits for the graph can be defined manually, and transit stop names are shown on the Transit Stops axis.
If the model is run with the Simulation Vehicle dialog open, the dynamic information contained in this dialog window is continuously updated while the simulation runs until the vehicle exits the network or the dialog is closed.