Building a Model
Note about licenses: To complete these exercises, you need a license for Aimsun Next Pro Micro, Advanced, or Expert Edition. If you have a Pro TDM Edition you will be able to do all the exercises except those related to control plans and dynamic simulations. If you have a Pro Meso Edition license, you will be able to run simulations with the mesoscopic simulator rather than the microscopic simulator.
- Exercise 1. Creating a New Model with a Template
- Exercise 2. Adding a Background
- Exercise 3. Creating Sections and Specifying Lanes
- Exercise 4. Creating Nodes
- Exercise 5. Adding Stop Lines
- Exercise 6. Assigning Road Types to Sections
- Exercise 7. Adding Solid Lines
- Exercise 8. Adding Detectors, VMS, and Pedestrian Crossings
- Exercise 9. Creating a Traffic State
- Exercise 10. Adding Centroids
- Exercise 11. Creating OD Matrices
- Exercise 12. Adding Traffic Demand
- Exercise 13. Running a Simulation with Traffic Demand
- Exercise 14. Creating Signal Groups
- Exercise 15. Creating Signal Phases
- Exercise 16. Adding Meters
- Exercise 17. Creating a Master Control Plan
- Exercise 18. Running a Simulation with a Master Control Plan
- Exercise 19. Defining Reserved Lanes
- Exercise 20. Adding Bus Stops
- Exercise 21. Defining Transit Lines
- Exercise 22. Running a Simulation with Transit
Introduction.
The goal of these model-building exercises is to start from zero and create a complete traffic network model with all the data you need to run a microscopic simulation. We will begin by basing the model on a template and background image and then building all the elements that constitute a network, including sections, nodes, lines, detectors, variable message signs (VMS), and bus stops.
We will also define the following key elements: a control plan for traffic lights; bus lines and timetables; reserved lanes for buses; a traffic state; centroids; OD matrices; traffic demand; and a scenario with an experiment that we will use for running the simulation.
The files related to these exercises are in [Aimsun_Next_Installation_Folder]/docs/tutorials/1_Editing.
Exercise 1. Creating a New Model with a Template
The first step is to create a new model. We will start with the built-in Aimsun template.
To create a new model:
-
Select File > New.
-
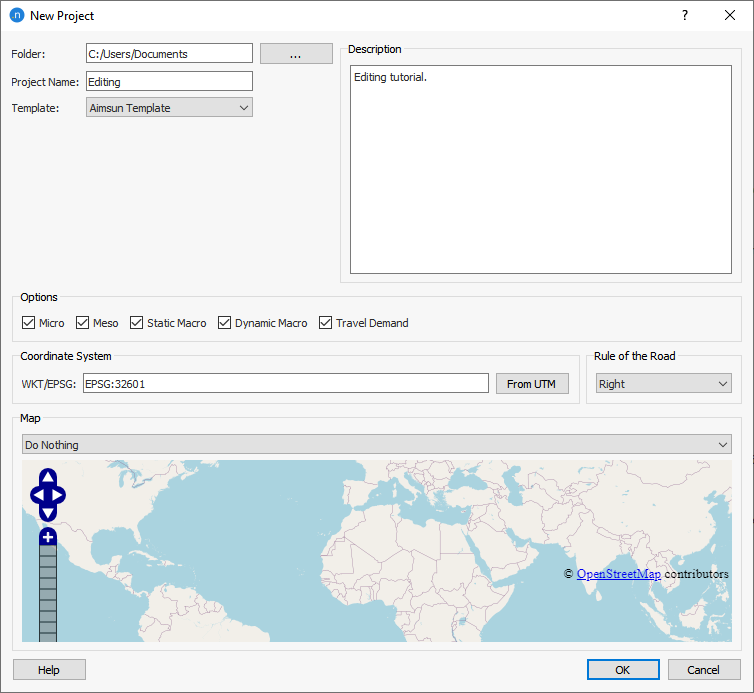
Complete the New Project dialog as shown below. Note that Aimsun Template is selected. Enter a Project Name and Description.
-
Click OK.
The project is saved as an Aimsun file (ANG file) and the template creates default Aimsun objects within the project, mainly Vehicle Types, Road Types and Reserved Lane Types. They are listed in the Project folder to the right of the main 2D viewing window.
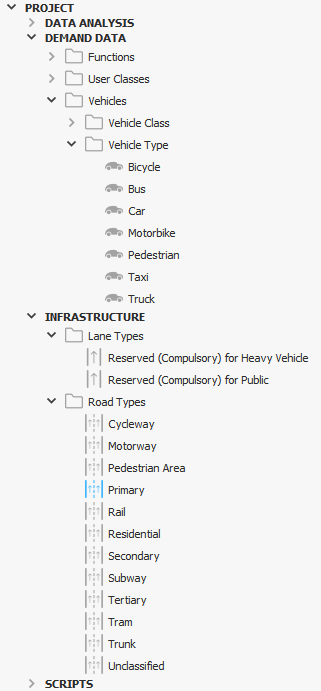
You can add new objects and save early versions of models as a template for similar future projects. To help identify a file, it's a good idea to add 'Template' as part of the file name.
Exercise 2. Adding a Background
There are many ways to create the geometry of a model in Aimsun Next. We could use an AutoCAD file or an image as a background (or base) and create the road network on top of it. Or we could import the road network directly using OpenStreetMap, GIS, or similar software.
We will use OpenStreetMap to import a Decoration layer and use an aerial photograph (orthophoto) to provide the geometric detail. Together these will form our background.
The usual procedure is to import the road network from OpenStreetMap – rather than just the decoration – and then to edit and refine it. However, these exercises are about learning how to create a network from the basics, so we will create the geometry ourselves instead. This is why, in the OSM Importer dialog, we will select Import Roads: No.
To add a background:
-
Select File > Import > OpenStreetMap Files and locate the file map.osm (in [Aimsun_Next_Installation_Folder]/docs/tutorials/1_Editing).
-
Click OK to begin importing. The OSM Importer dialog is displayed.
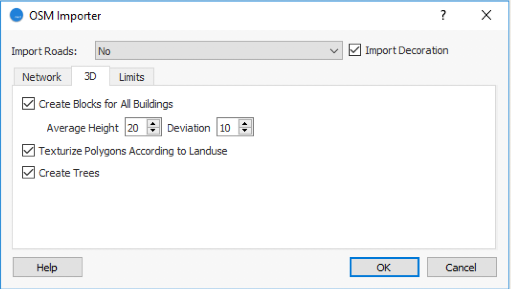
We can create the 3D model during the import using blocks to represent buildings with an average height. The import can also color elements by land use, assuming this information is available in OSM.
-
On the Network tab, keep the original parameters and click on the 3D tab. Set the parameters as shown below and click OK.
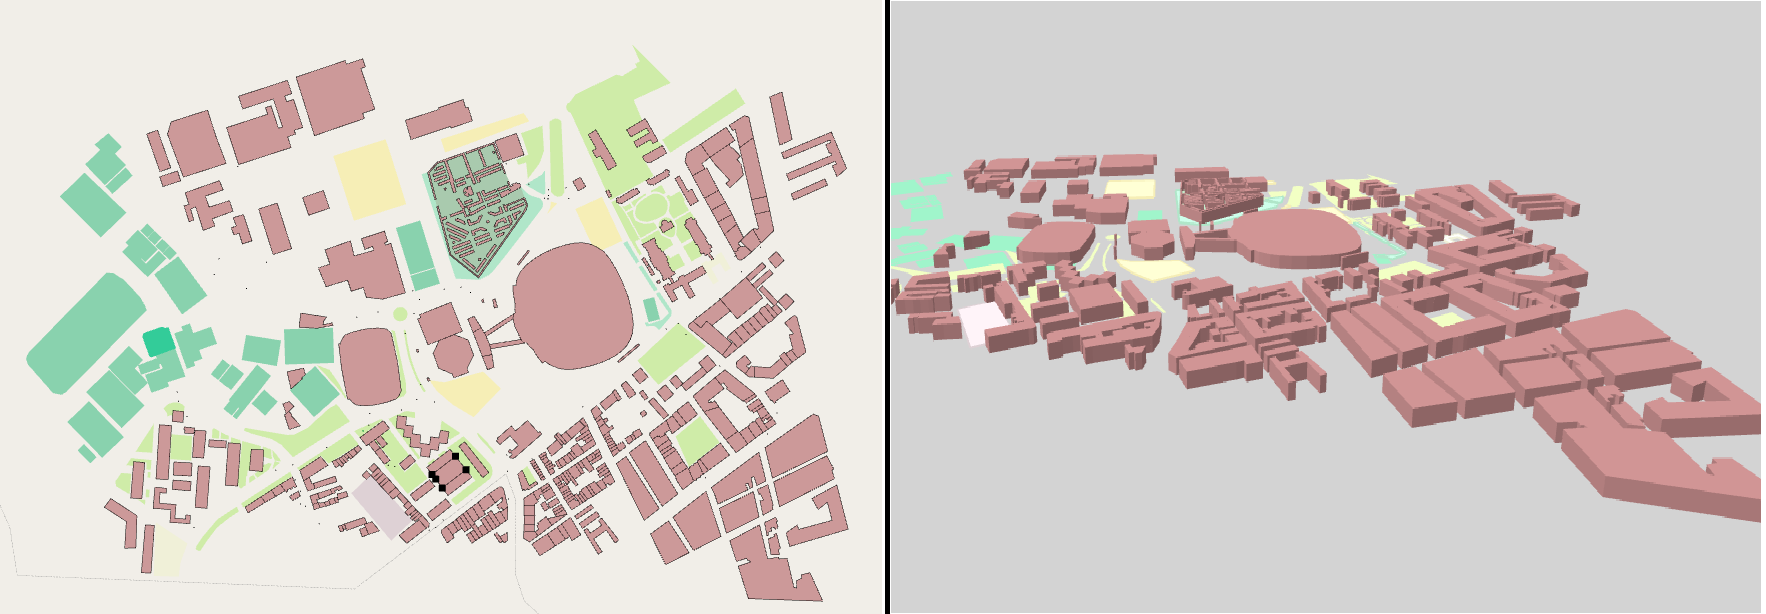
The import introduces building outlines in 2D and 3D along with green spaces and other types of land use. If you want to look at the 3D view, select View > New 3D View. At the moment it's best to close the 3D view before continuing with the exercise.
Now we will import the aerial photograph.
-
Select File > Import > Image File and locate orthophoto.jpg (same location as the OSM file).
-
Click OK to begin importing. The Import Image dialog is displayed.
-
Click OK again to import and display the photograph.
Once the photograph is visible, we need to position it correctly in the model using the Positioner feature in the image properties dialog. Rasterized images are not georeferenced, so we should use a well-georeferenced template (like our imported OSM) to position the image correctly.
-
Click and drag the photograph so that it doesn’t overlap the OSM decoration. This will make the selection of reference points easier.
-
Double-click on the photograph to open its properties and click the Positioner tab.
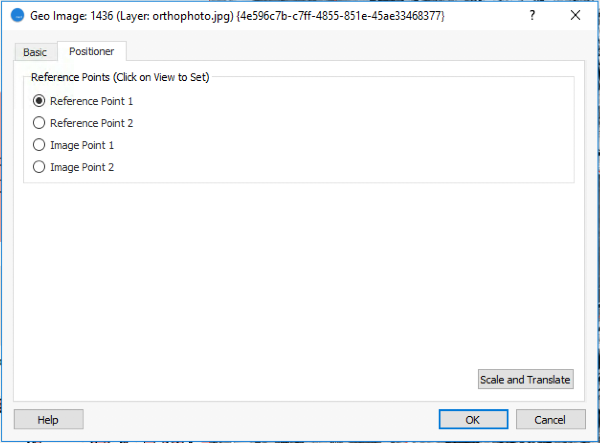
-
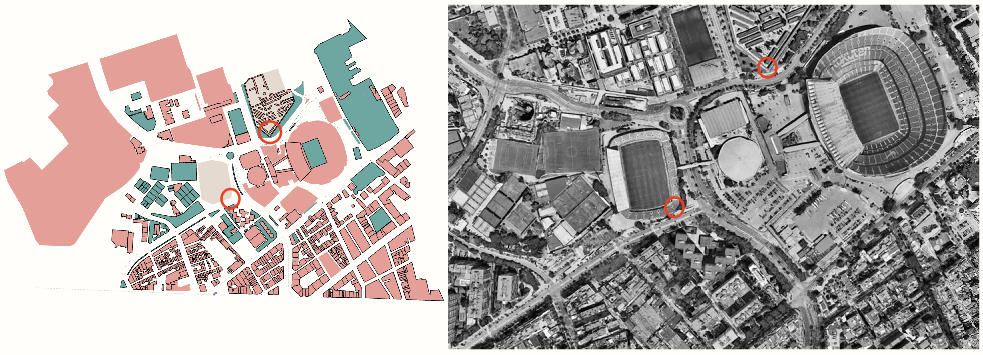
Find two distinguishing points that you can identify in the imported OSM objects and click on them. These will be Reference Point 1 and Reference Point 2.
-
Find the same distinguishing points in the photograph and click on them carefully. These will be Image Point 1 and Image Point 2 and they must match your reference points as closely as possible.
Suitable points to click could be those shown in the figures below.
-
Click Scale and Translate to correctly position the photo over the background.
Once the photograph is properly positioned, it's a good idea to lock the layers that contain the OSM objects and the photograph so that background objects cannot be accidentally edited or moved.
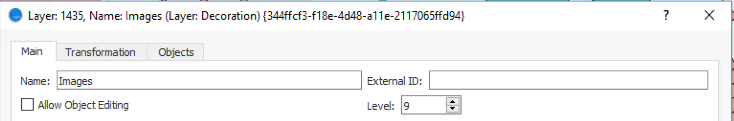
-
To do this, go to the Layers window, double-click on the layer named Images and untick the option Allow Object Editing. Repeat this for the layer named OpenStreetMap.
Finally, we need to lower the 'level' of the photo so that it is displayed underneath the OSM objects (the 'decoration'). The OpenStreetMap is on level 10, so the photograph requires a lower-level number.
-
Double-click the Image layer and change Level to 9. The photo now seems to sit beneath the decoration objects.
Exercise 3. Creating Sections and Adding Lanes
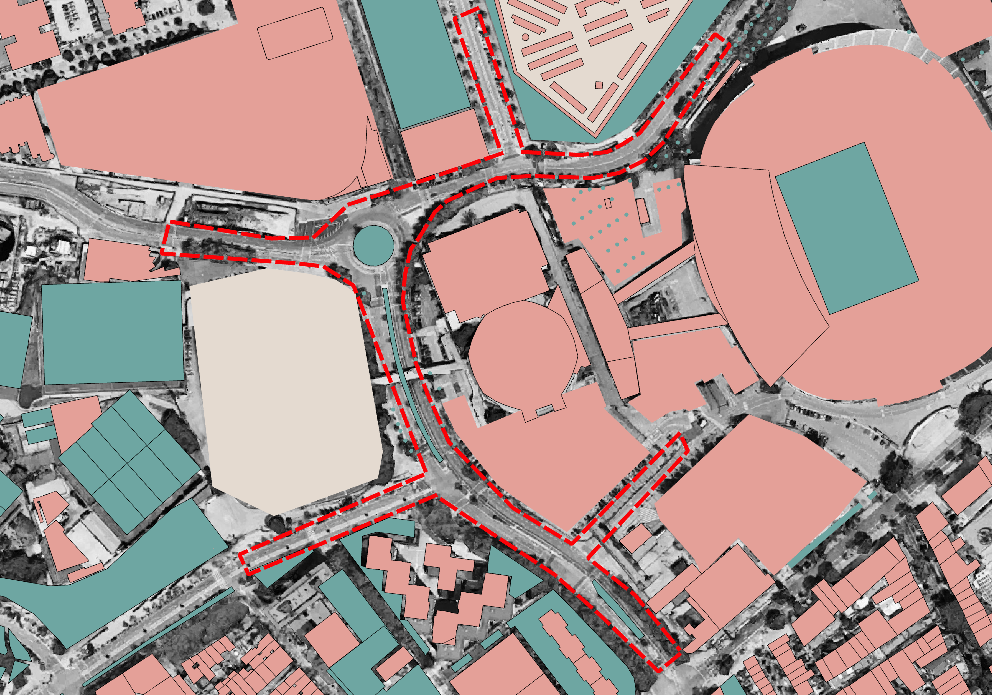
Now we have the background in place we can start adding the geometry of the network in the places marked with dotted red lines below. In this exercise we will create road sections and add lanes.
Creating a basic road network usually involves these high-level steps:
-
Add and shape road sections.
-
Specify the number of lanes in sections.
-
Specify the road types of sections.
-
Join the sections together with connecting nodes (junctions).
When you are more familiar with Aimsun Next you might choose to build your networks in a different manner or order.
We are going to create all the sections we need to define the road network for our model. When we are finished, it should resemble the illustration below.
3.1 Creating a Section
To create a section:
-
Click
 and click in the model at the point where you want the section to start.
 -
Using the background as a guide, click at intermediate points along the path of the section and double-click where you want the section to end. It will be drawn in place and will resemble a classic section of road: gray with white lines.
-
Optional: You can change the position of the section by clicking on it (this reveals its component elements) and dragging its center-line update points (circled in red below).
-
Add all the other sections you need according to the illustrated road layout.
3.2 Shaping a Section, Using Straight or Curved Segments
You will often need to shape a section to fit the background map or layout. You can do by using the tools, Create a Vertex (Straight)  and Create a Vertex (Curved)
  . You can use them separately or together to alter or finalize the shape of a section.
The first tool defines straight segments, and you can add as many straight vertices to a section as you need. The second tool enables you to add up to two curved vertices to a section and between straight vertices.
To shape a section:
-
Click on the section you want to shape.
-
Click one of the Create a Vertex tools and drag a line across the section at the point where you want to shape it. This will place a straight or curved vertex into the section, along with its control point.
-
Optional: Add more vertices as required.
-
Click and drag the control points until you have the desired shape of section. It's a good idea to practice adding and moving these control points until you can create straight and curved stretches to fit your network and background.
3.3 Specifying the Number of Lanes in a Section
By default, sections have two lanes. You can increase or decrease this number to match the roads you are modeling.
To specify the number of lanes:
-
Click on a section to highlight it. To select several sections together, press and hold Shift while clicking the required sections.
-
Press and hold Ctrl and type a number from 1–20 to add this number of lanes to the section or sections.
If you want to change the number of lanes for a section, repeat these steps for the section(s).
3.4 Adding a Side Lane to a Section
The network we are building features two side lanes where roads merge with or split from a section.
To add a side lane to a section:
-
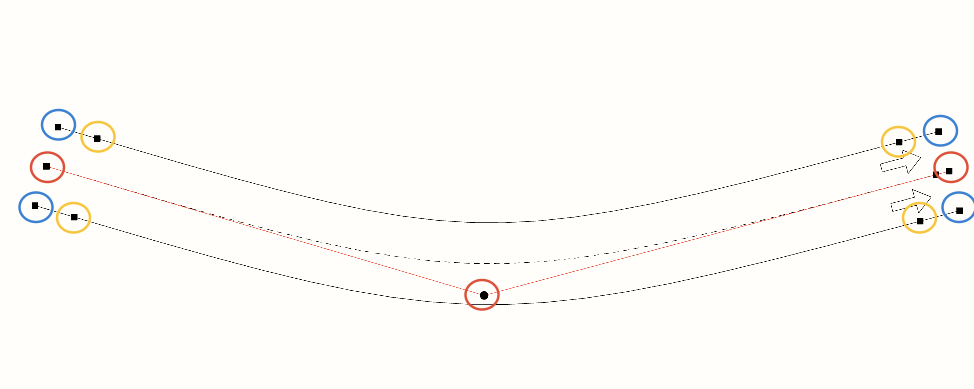
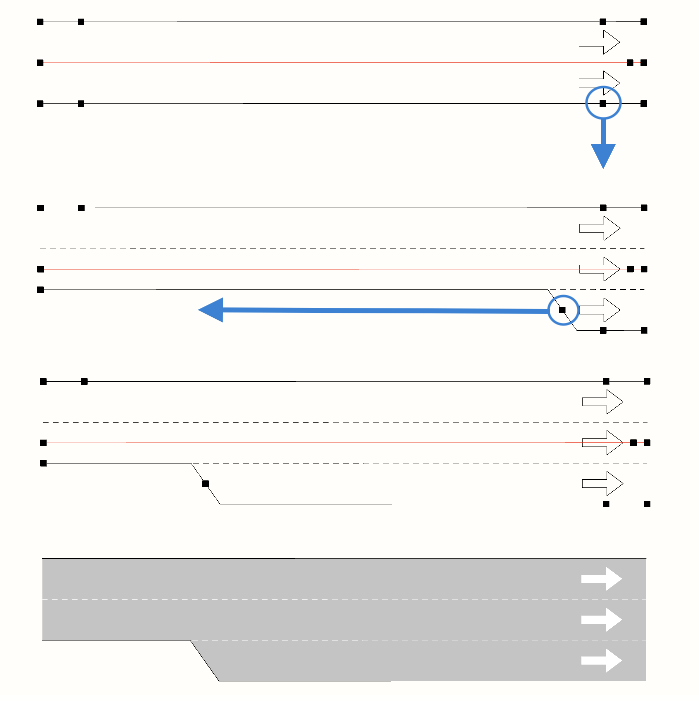
Click on a section. Its lateral update points (circled in blue in the top example below) become available.
-
Drag the lateral update point away from the section to create the side lane. This new side lane will have a central update point at its end.
-
Drag this new update point alongside the section to change the length of the side lane. The blue arrow in the second example below indicates this action and the third example shows the central update point in its new place.
3.5 Joining Sections
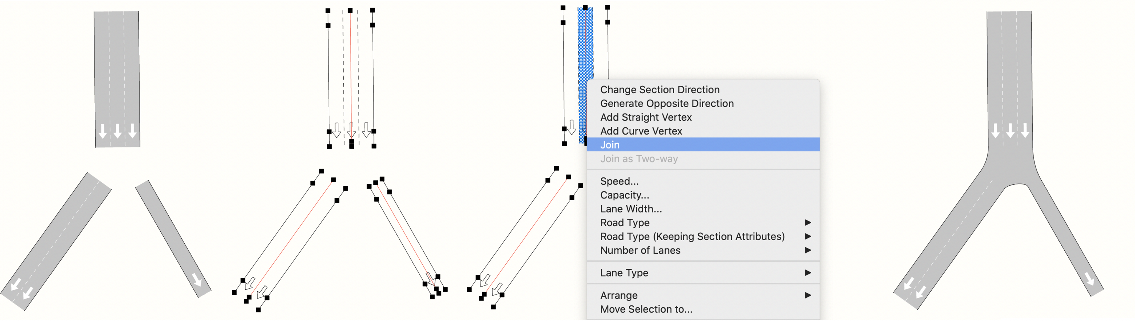
Now we have a collection of separate sections, we need to join them together according to the logical flow of traffic. You can join two sections with a 1:1 link to create a longer continuous section. You can also join three or more sections to create simple convergences or divergences where there is no conflict in vehicle movements.
The number of lanes in sections you are joining needs to be compatible. In the example below, a section with three lanes is successfully joined to a section with two lanes and a section with one.
If you try to join the three-lane section to two sections with two lanes each, an error will occur because you are trying to connect three lanes to four lanes. If you try to join the three-lane section to two sections that have three lanes each, the section will be joined to one of the other sections, but cannot connect to both.
To join sections:
-
Decide which sections you want to join together and select them.
-
Right-click on any of the selected sections and select Join. Tip: you can also press Ctrl+M to join them.
More information about nodes is contained in Exercise 4.
Exercise 4. Creating Nodes
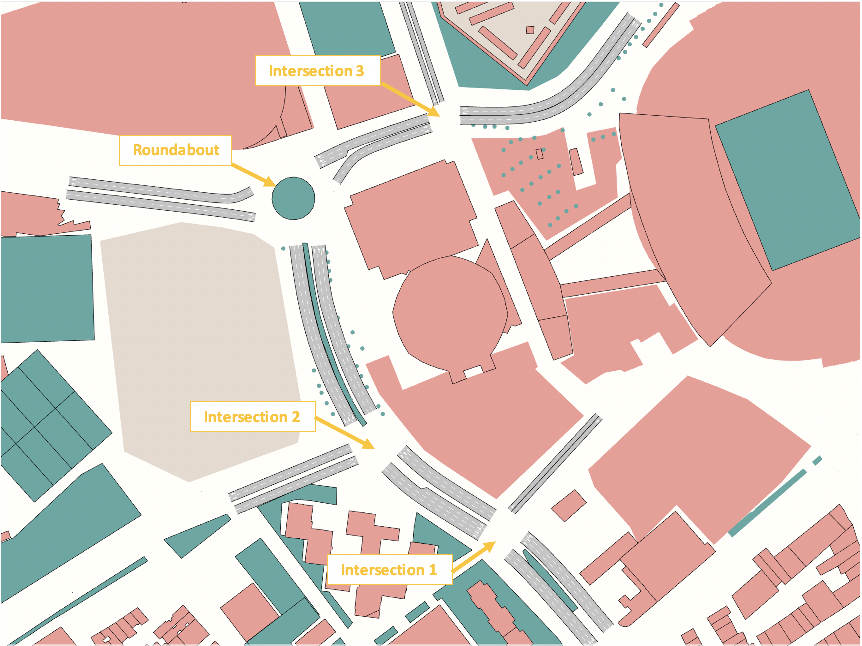
In this exercise, we will create the nodes that link the three intersections labeled 1–3 in the illustration below. You can create nodes automatically or manually. We will consider the roundabout in our network after we have created the intersections.
4.1 Creating Nodes
To create a node:
-
Select all of the entrance and exit sections that will flow into and out of the node.
-
Click the Create a Node icon
 to automatically draw and place the node that represents the intersection.
-
Optional: Double-click on the node to modify its parameters, its layout or the lanes used by each turn.
You can also create the node manually by selecting and joining lanes, adding the necessary turns as you go.
To create the node manually:
-
Click the Create a Node icon
to display a new 'empty' Node dialog. -
Click New.
-
In the 2D view, select the origin lanes flowing into the node and then the destination lanes flowing out that you want to connect to.
-
Repeat steps 2 and 3 for all lanes you want to connect as part of the node.
-
Click OK.
The screenshot below shows the intersection created this way and the turns (depicted by arrows) that link lanes together.
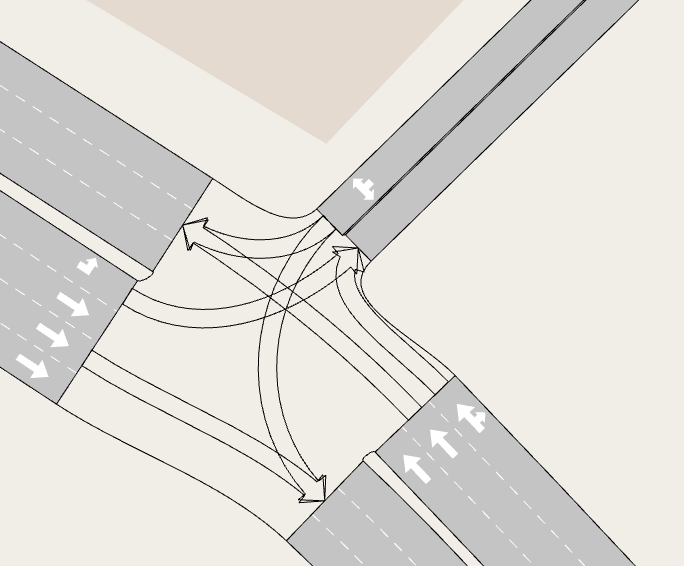
You can also add a turn with the Create Connections Between Objects. Click
 and then click on the start section and drag a line to the end section. Tip: you can press F9 instead of clicking the icon.
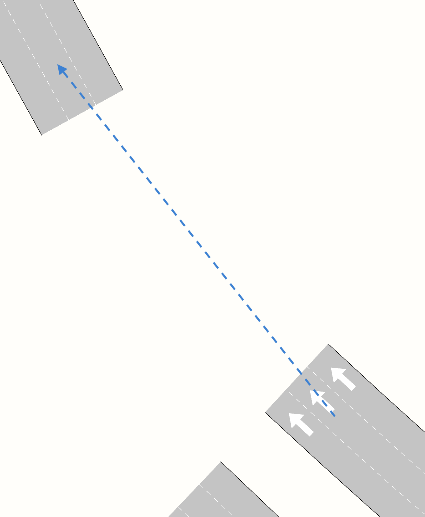
4.2 Adding Yield to Turns
Some turns will require Yield (Give Way) restrictions and markings.
To add yield restrictions to turns:
-
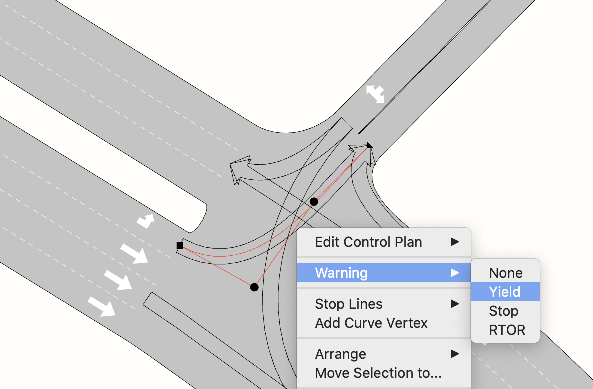
Select the relevant node and then select one or more turns that require Yield restrictions.
-
Right-click on the turn(s) and select Warning > Yield as shown in the screenshot below.
To add yield restrictions inside a node's settings:
-
Double-click on a node to open its dialog.
-
For each affected turn, select Yield in the Warning column. As you select turns in the dialog, they will be highlighted in the 2D view to confirm your choices.
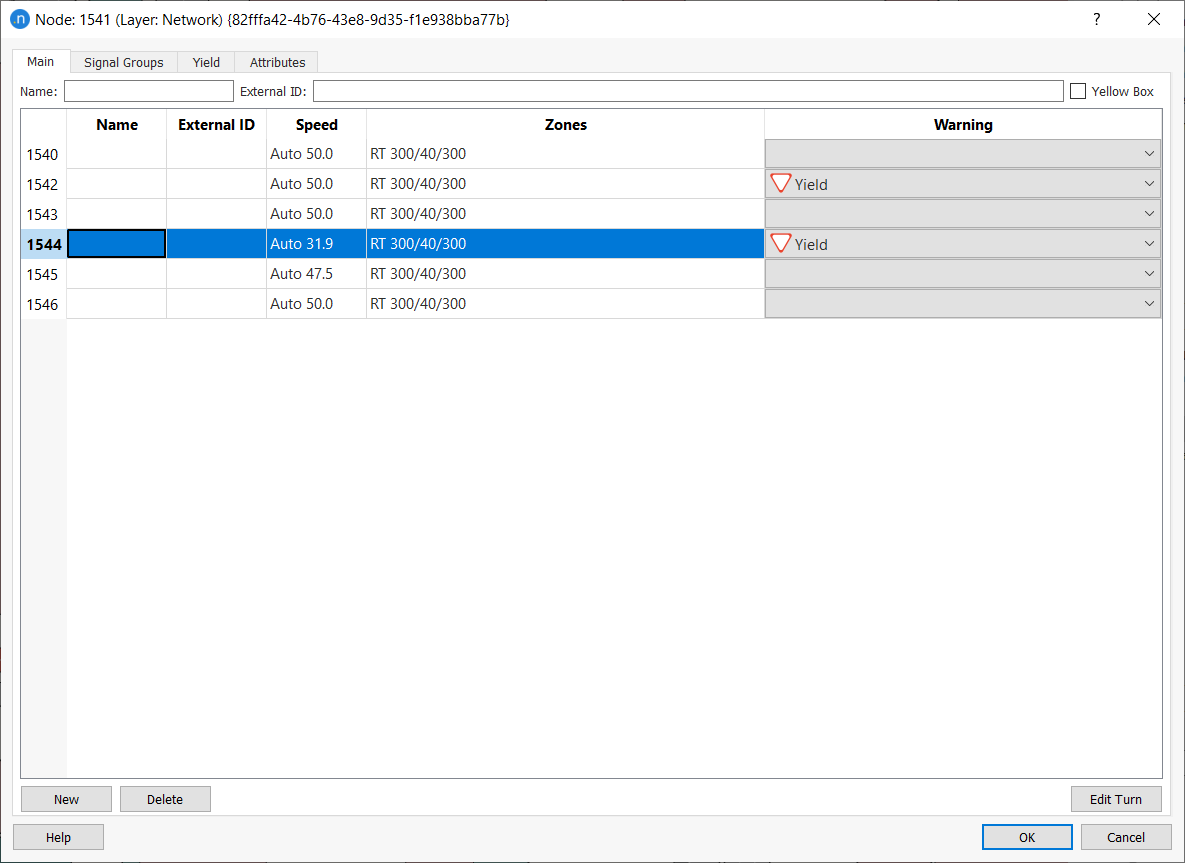
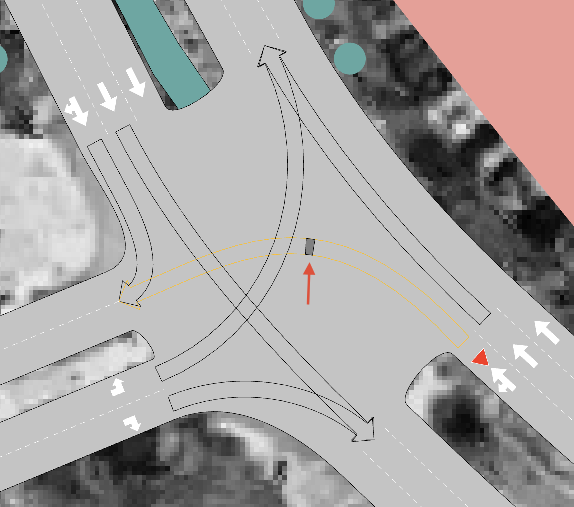
The screenshot below shows a turn with a Yield restriction (red triangle) in place.

4.3 Creating Roundabouts
To create a roundabout, use the Create a Roundabout tool  as follows:
-
Select all sections entering and exiting the roundabout.
-
Click
. -
Click in the 2D window where you want the center of the roundabout to be and keep the mouse button held down.
-
Type CTRL+[number of lanes] (3 in the example below) and drag the shape of the roundabout outwards until it meets the sections. Release the mouse button to place the new three-lane roundabout.

To adjust and shape the roundabout, modify the section geometry to smooth the turns entering and exiting the roundabout. Set any priorities and restrictions and ensure that the origin and destination lanes for each turn are correctly linked.

Exercise 5. Adding Stop Lines
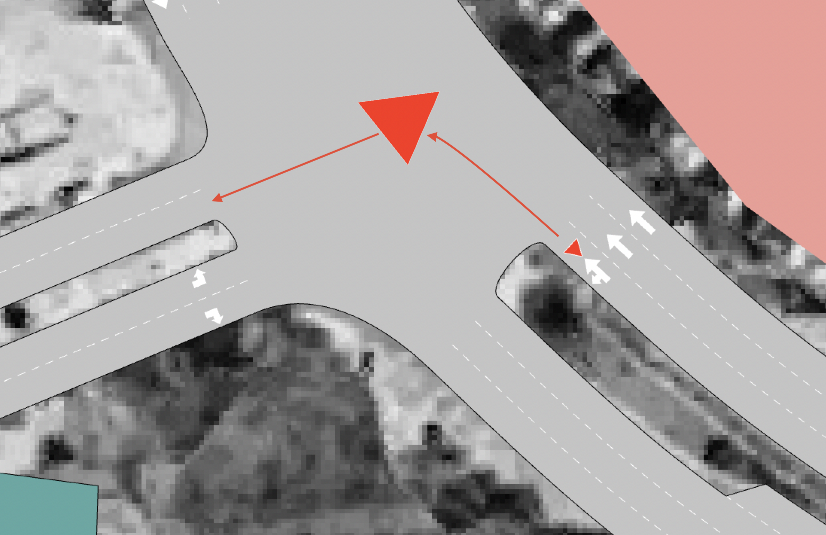
We're going to add a stop line to Intersection 2, to modify the place where vehicles wait to yield to other traffic. On the northbound left turn, vehicles do not stop at the traffic light, they enter the intersection and wait for a gap in traffic before completing the turn as shown below:
To create this waiting point, we will add a stop line to the affected turn.
To add a stop line:
-
Click on the node to reveal the turns.
-
Right-click on the relevant turn and select Stop Lines > New.
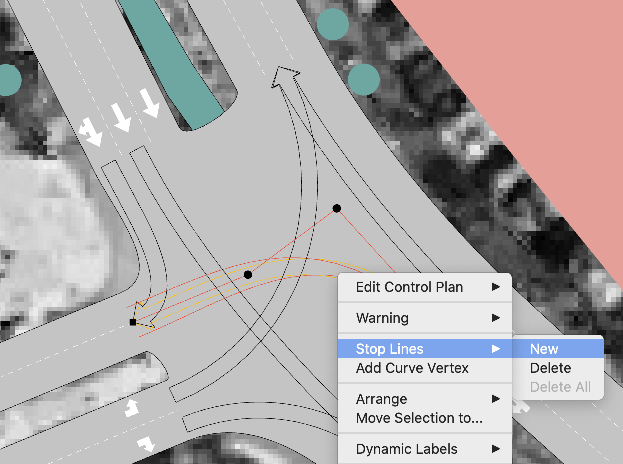
This adds a stop line, as shown below.
-
To position the stop line accurately, click and drag it along the turn to the point where you want vehicles to wait. Make sure that the stop line does not overlap with or affect another turn.
-
If required, change the shape of the turn by moving its positional vertices.
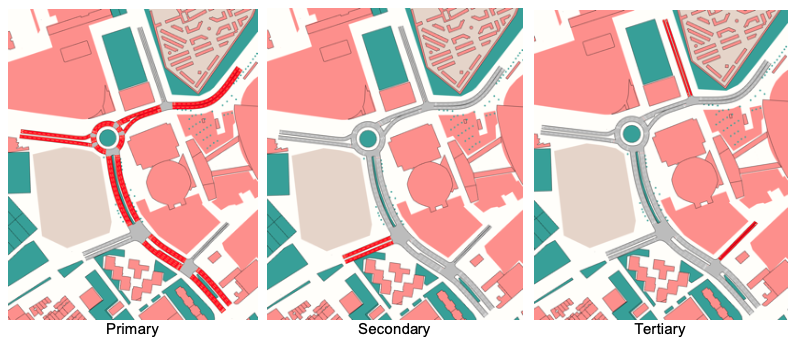
Exercise 6. Assigning Road Types to Sections
Currently, all road types are defined as Primary. You can check this in the Project folder by selecting Infrastructure > Road Types and double-clicking on Primary. This highlights all the Primary roads in the network. We will add Secondary and Tertiary road types to the network. The eventual road types are marked in red below.
To assign the Secondary road type to sections:
-
Select the required sections as illustrated above.
-
Right-click on one of the sections and select Road Type > Secondary.
The same procedure works for tertiary roads and other available road types (Motorway, Cycleway, and many others).
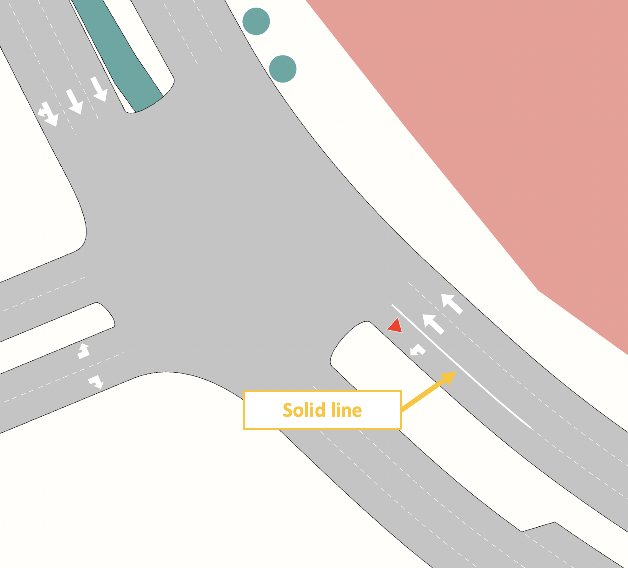
Exercise 7. Adding Solid Lines
Solid lines mark where changing lanes is prohibited. We will add a solid line for the left-turn-only lane, as shown below.
To add a solid line:
-
Click
 and then click on the dashed white line to add a solid line.
 -
To change the length or position of the solid line, click to select it and drag it to a new position. You can also drag its vertices to make it longer or shorter.
Exercise 8. Adding Detectors, VMS, and Pedestrian Crossings
In this exercise we will add three new types of object to the network: detectors, a variable message sign (VMS), and a pedestrian crossing.
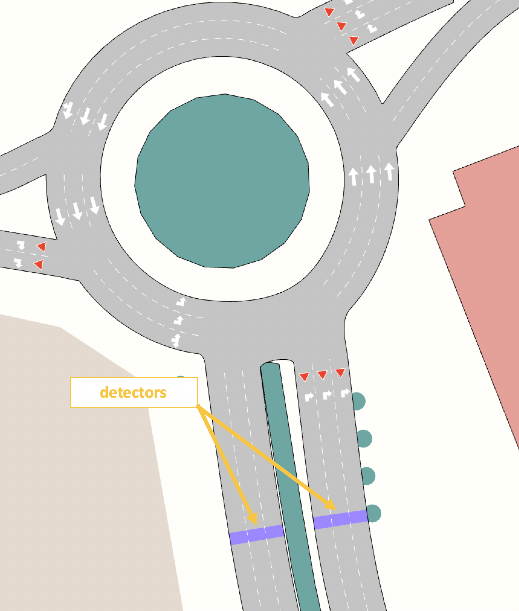
8.1 Detectors
We need to place two detectors in the network, as shown below.
To add a detector:
-
Click
 and then click on the section at the desired location to place the first detector. The detector appears as a colored rectangle across the section.
 -
Repeat for the second detector.
-
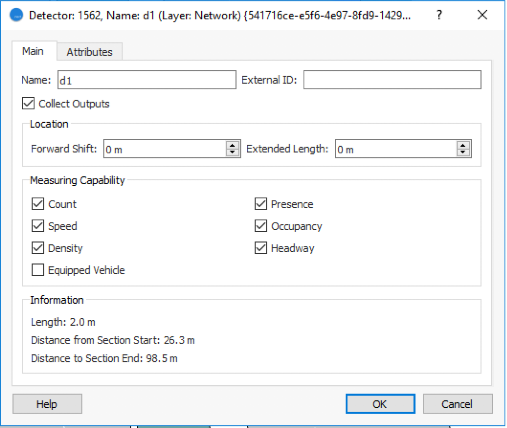
Double-click on each detector to display its dialog and enter new names in the Name field (d1 for the southbound section and d2 for the northbound).
-
Set their Measuring Capability options as shown below.
-
Click OK.
8.2 VMS
We will now place a variable message sign (VMS) on one of the main roads of the model.
To add a VMS:
-
Click
 and then click on the section at the desired location to place the VMS. The sign appears as a gantry over the road.
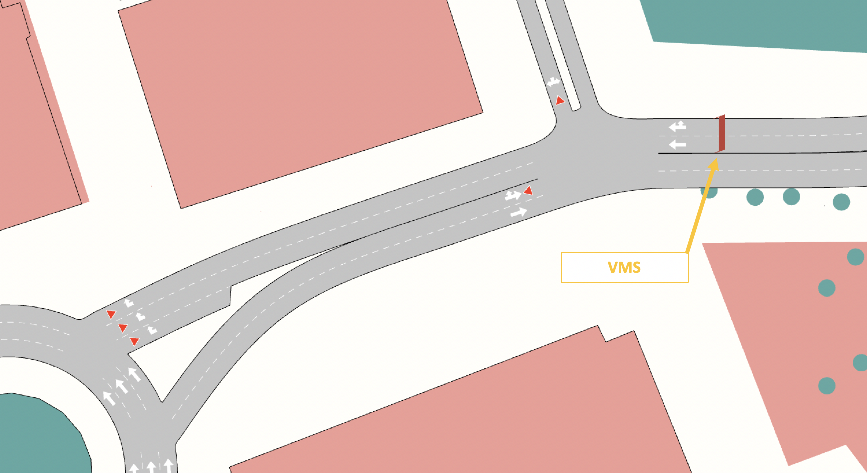
-
Double-click on the VMS to display its dialog and enter VMS1 in the Name field.
If you want to know more about these signs, click VMS.
8.3 Pedestrian crossings
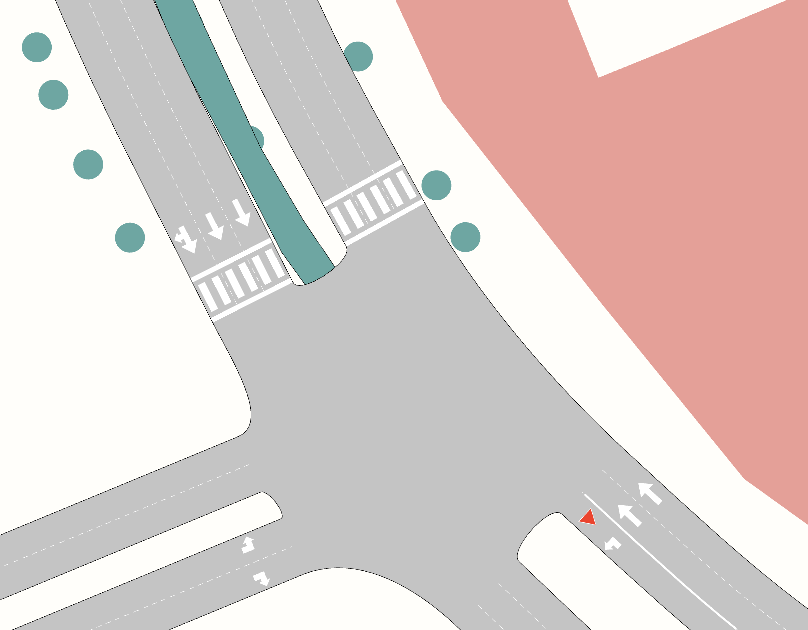
We will now add a pedestrian crossing that gives access to Camp Nou stadium. The crossing will cover two sections just to the north of Intersection 2, as shown below.
To add a pedestrian crossing:
-
Click
 and click on a section to place the crossing.
The crossing will be automatically placed at the beginning or end of the section, whichever is closer. Crossings cannot be placed in the middle of a section. If a crossing is in the middle of the road, the section must be cut to place a crosswalk.
-
Repeat for the second crossing on the second section.
Exercise 9. Creating a Traffic State
Aimsun Next has two means of representing demand: traffic states and OD matrices.
-
Traffic state is a simple representation of the demand which requires only the flows in a network and the turning proportions.
-
OD matrices use a set of centroids to define the start and end points of trips, connections to the road network, and a matrix of trips between the centroids.
In this exercise we will define a traffic state as our demand.
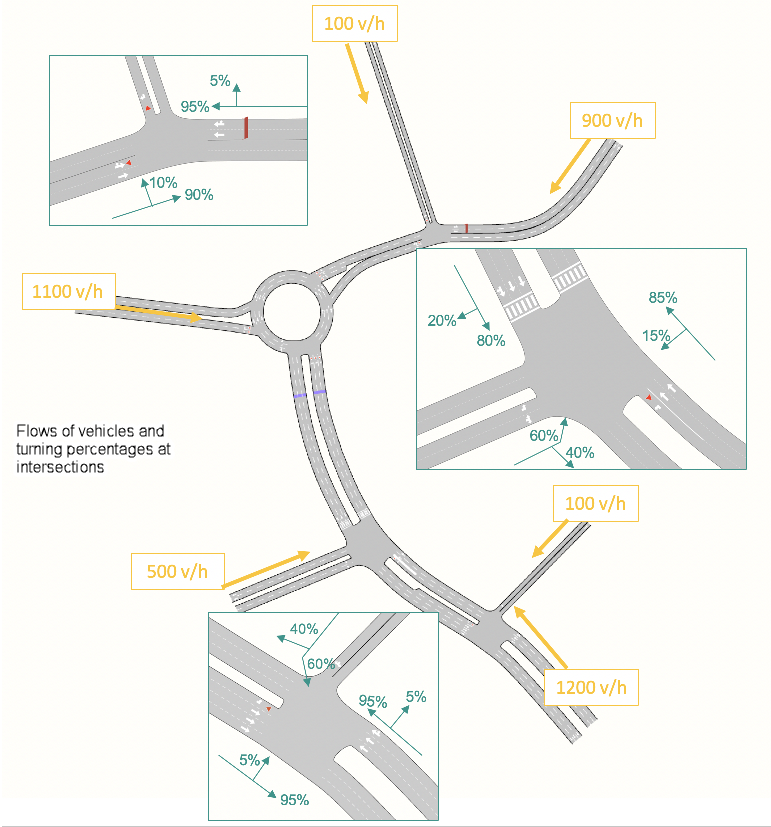
The diagram below shows all the information necessary to create a traffic state (excluding the roundabout, which we will discuss later).
To get this data into the model, we need to create a new traffic state and then input the flow and turning percentage values.
To create a traffic state:
-
Select Project > New > Demand Data > Traffic State. In the Project folder, the folder Traffic States will be added, with an empty Traffic State inside it.
-
Double-click on the traffic state to open its dialog.
Make sure you can see both the traffic state dialog and the 2D view. As you click on items in the dialog, they will be highlighted in the 2D view.
-
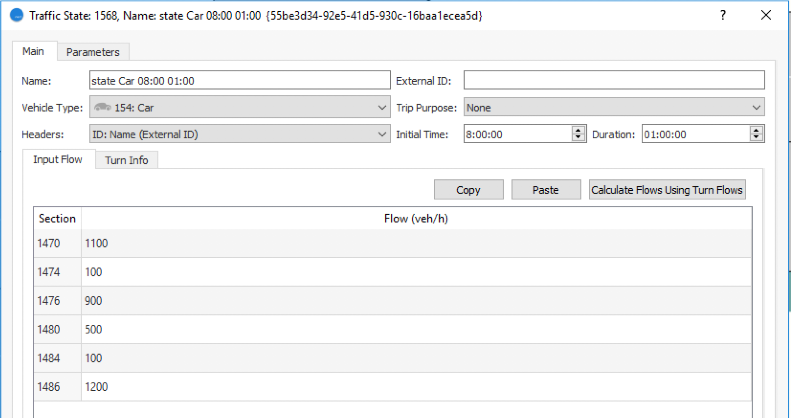
For Vehicle Type, select Car.
-
Set the Initial Time as 08:00:00 and the Duration as 01:00:00.
To input the flow values from the diagram above:
-
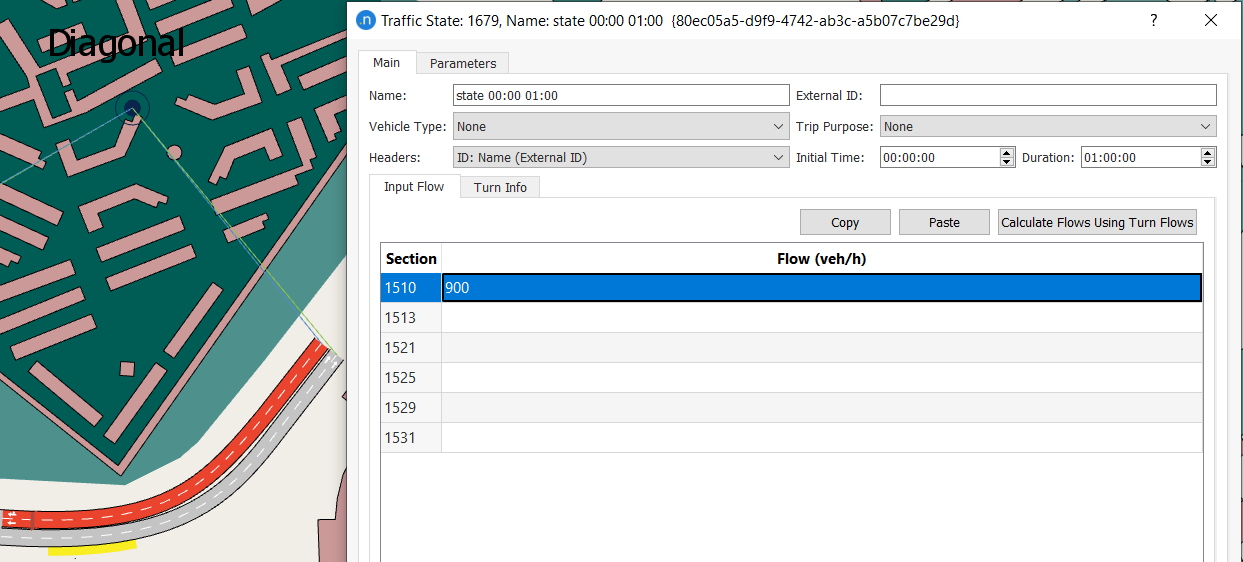
Click the Input Flow tab.
-
Click on the first listed Section to highlight it (you can see it marked in red in the 2D view), click on the adjacent cell in the column Flow (veh/h) and enter 900. It will look something like the screenshot below.
-
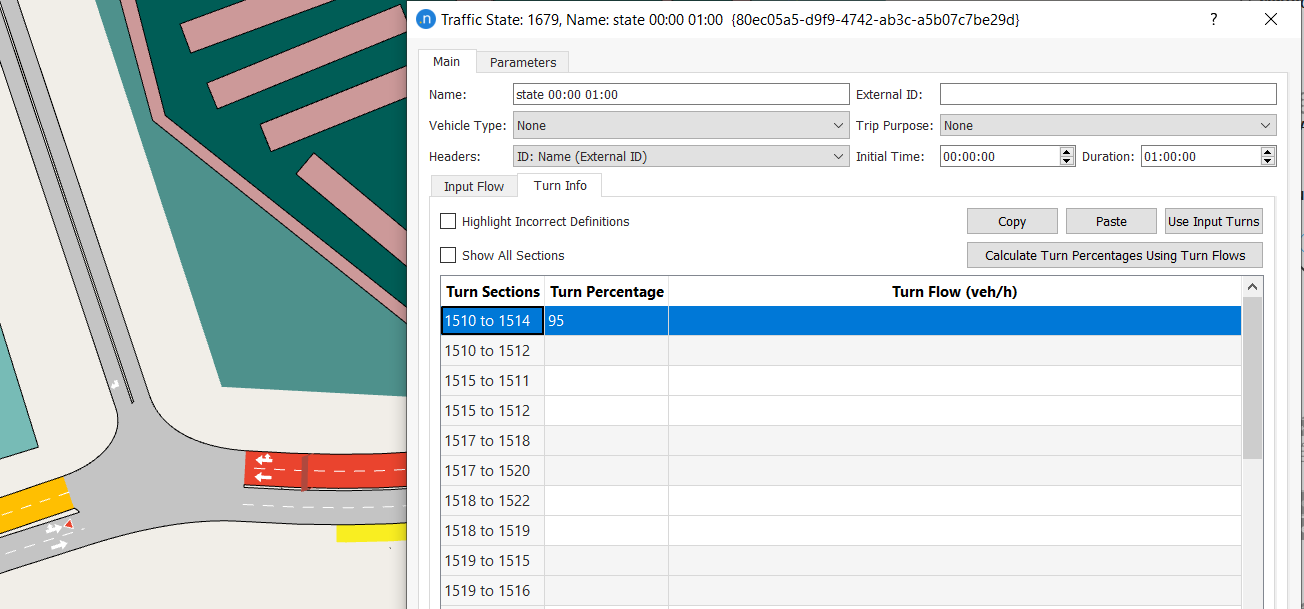
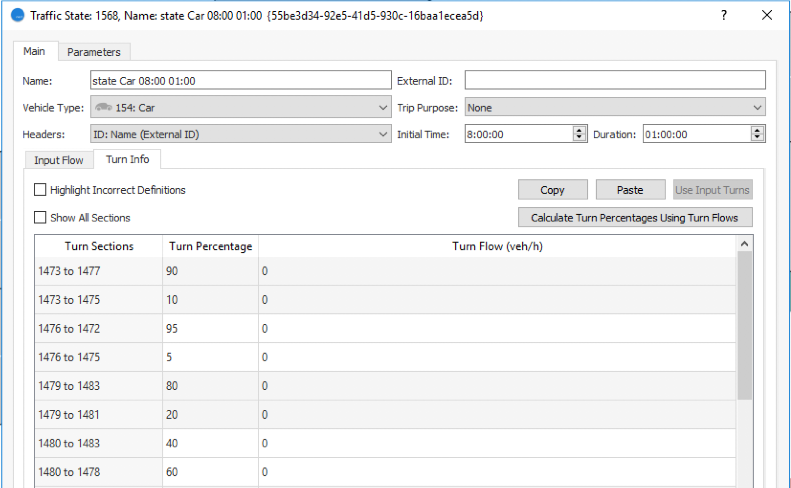
Click the Turn Info tab.
-
Click on the first of the Turn Sections to highlight it (you can see the turn marked in red and yellow in the 2D view), click in the adjacent cell in the column Turn Percentage and enter 95.
-
Repeat steps 1–4 for each Section and Turn Section until you have input all flow and percentage values. Any incomplete percentages will trigger an error message.
When you have input all the data, the Traffic State dialog should look similar to the next two screenshots.
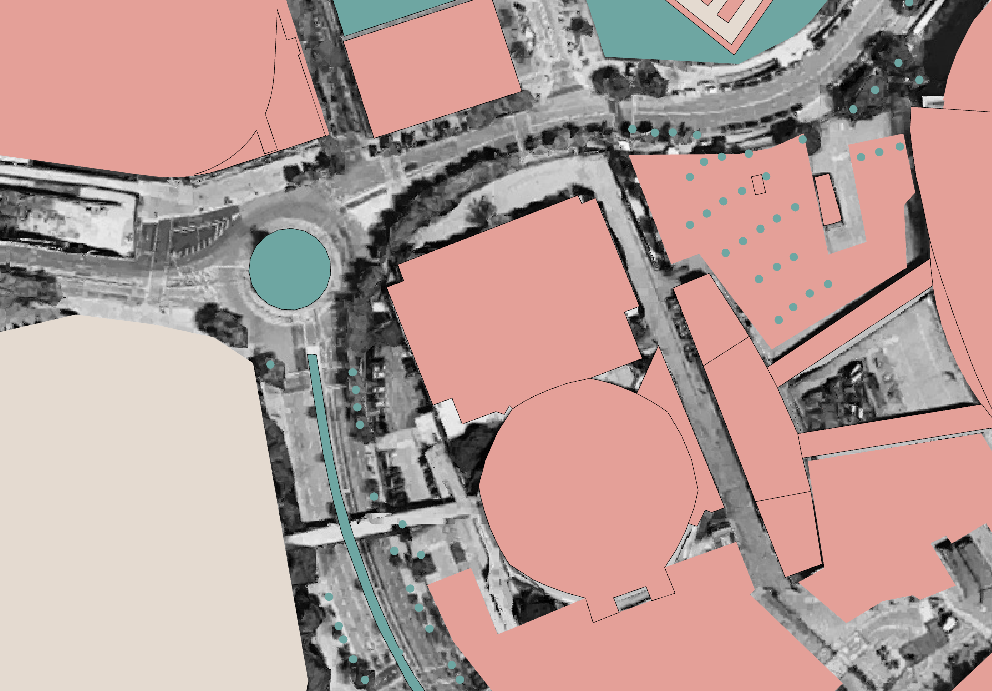
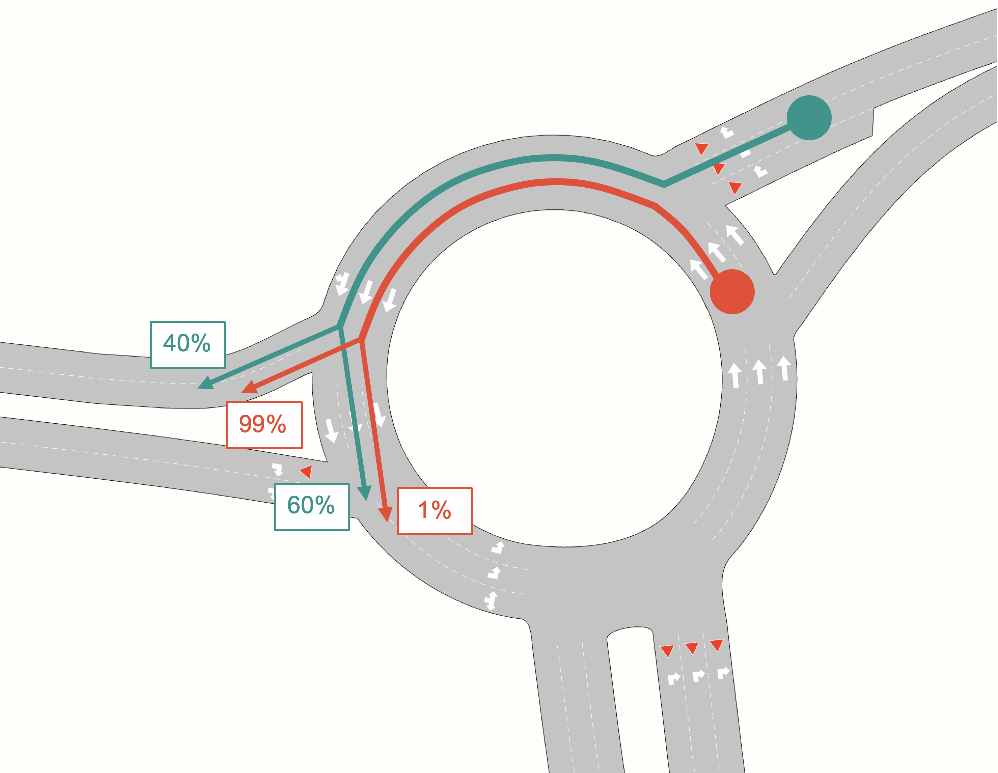
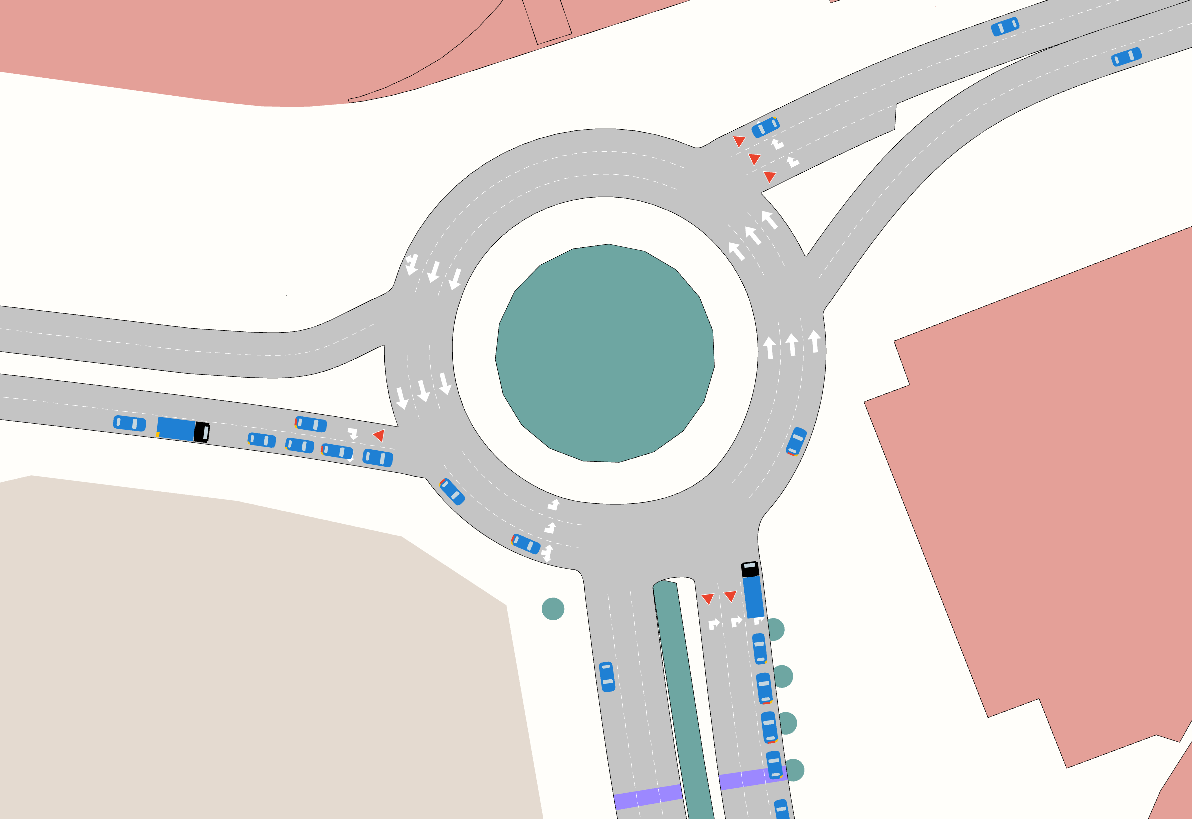
Sections with Multiple Entrances
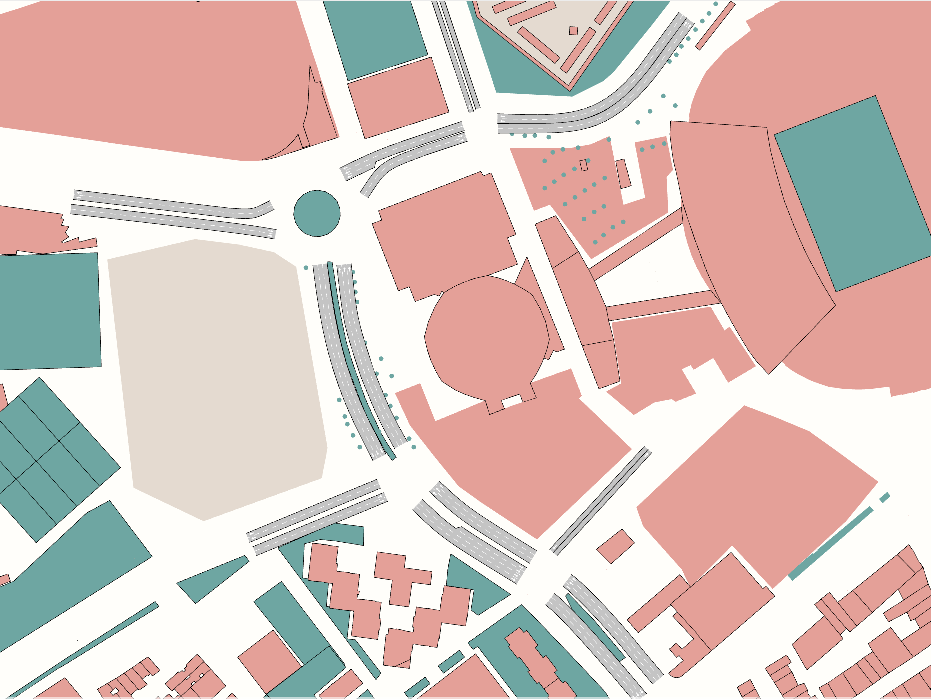
Some sections have multiple entrances and sometimes vehicles arriving at the section behave very differently depending on where they have come from (their section of origin). In the screenshot below, for example, vehicles that are on the roundabout (arriving from the section marked by the red dot) mostly want to exit (99%) and those arriving from outside the roundabout (from the section marked by a teal dot) have more balanced behavior patterns (60% want to stay on and 40% want to exit).
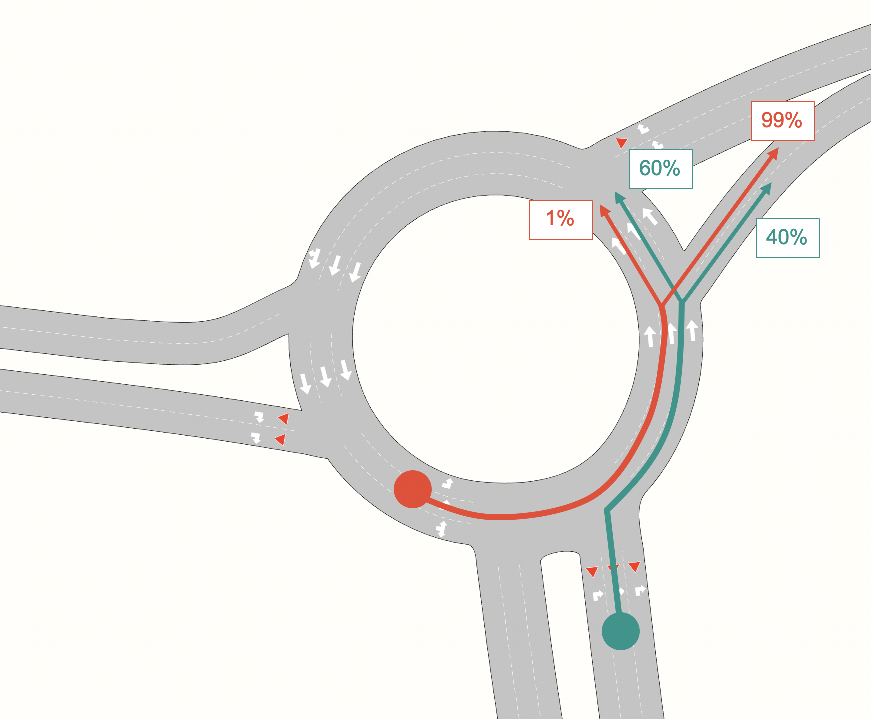
In Aimsun Next, you can define exit percentages for a section that are influenced by the percentages of vehicles in a prior section.
To define exit percentages:
-
Open the Traffic State dialog.
-
Click on the affected section of the roundabout to highlight it in the dialog and in the 2D view.
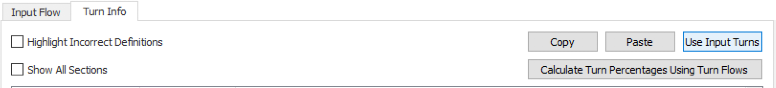
-
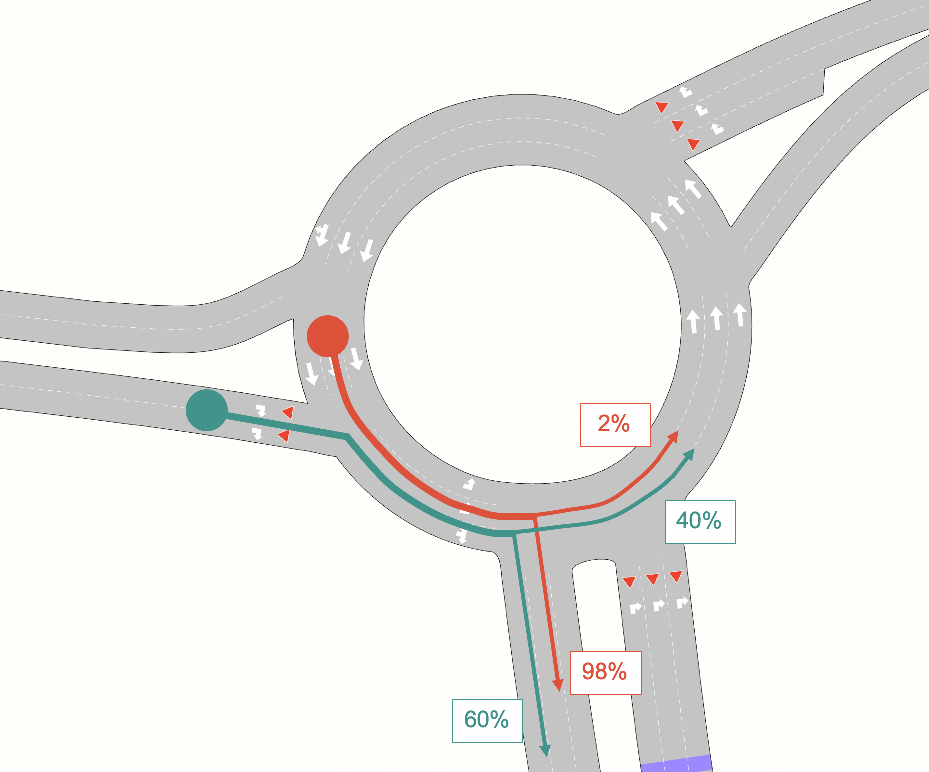
Click Use Input Turns and then input the percentages for this section:
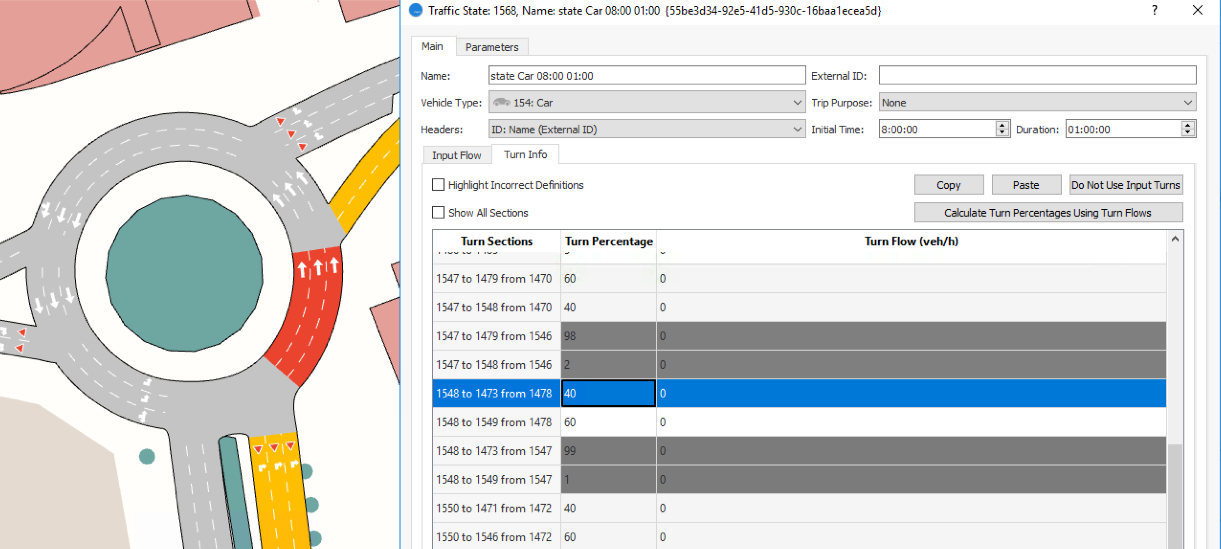
-
The other two exits on the roundabout have the percentages shown in the two screenshots below. Input these values also.
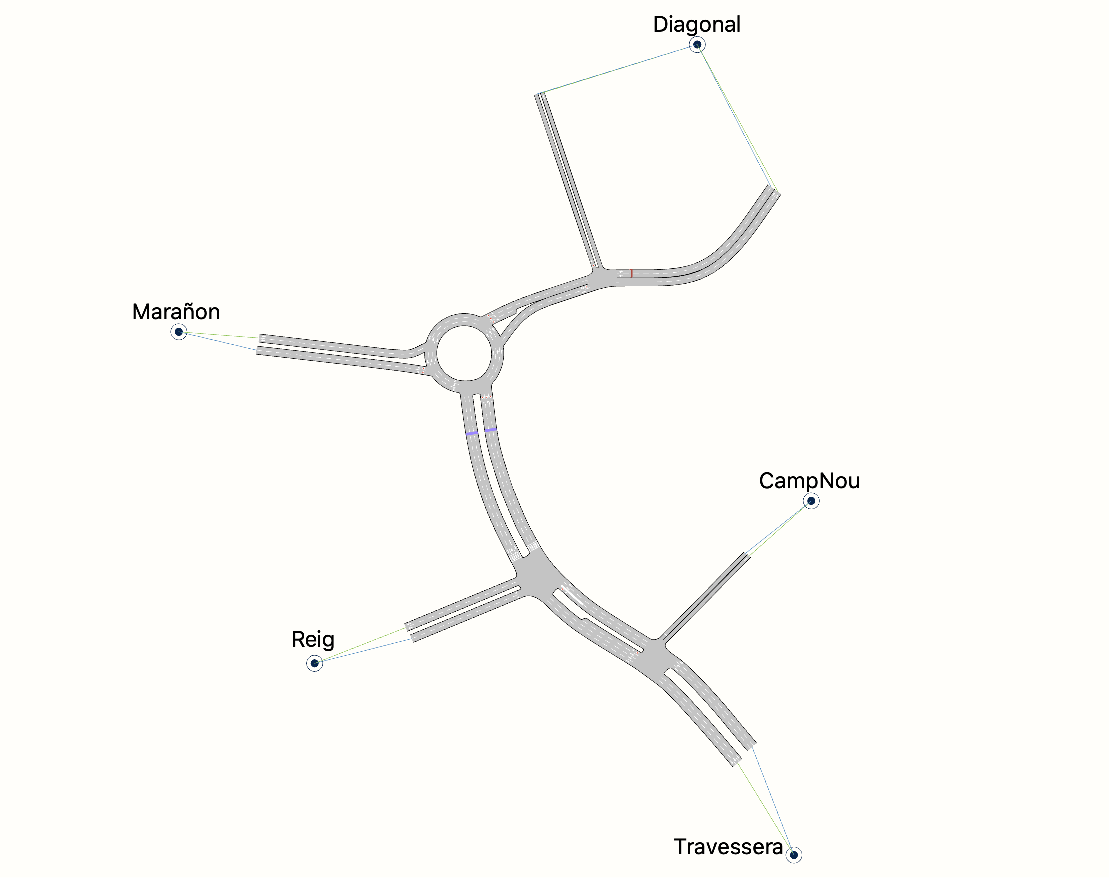
Exercise 10. Adding Centroids
Centroids are required when traffic demand is defined by OD matrices. They are the origins and/or destinations of trips in the network and introduce flow into the model. When using OD matrices rather than a traffic state, you need to add centroids first.
In this example, we will define the five centroids and their connections as shown below, beginning with the Marañon centroid. Pay attention to the fact that Diagonal connects to four sections whereas all the others connect to two. This will require a percentage split of vehicles traveling to the four sections.
To add a centroid:
-
Click
 and then click on its location in the network.
A new object, Centroid Configuration, is added to the Project folder in the Centroid Configurations folder.
-
Double-click on the centroid to open its dialog.
-
In the Name field, enter Marañon. It is much easier to work with named centroids this will make it easier to work with the matrix later.
-
To create connections between the centroid and the network:
i. Click New and, in the 2D view, select the section that will receive vehicles from the centroid. In the dialog this is termed Generates to.
ii. Click New again and select the section that exits to the centroid. In the dialog this is termed Attracts from.
-
Click OK.
-
Repeat for the remaining centroids in the illustration.
Tip: You can also use the Create Connections Between Objects tool to add the centroid connections.
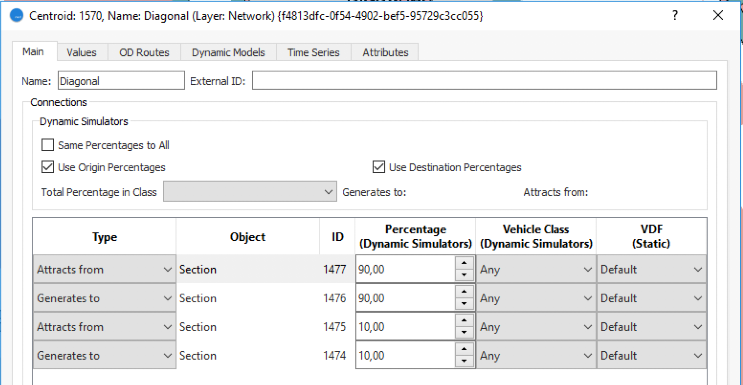
For the centroid Diagonal alone:
-
Open the centroid.
-
Check the box Use Origin Percentages and, in the Percentage column, enter 90.00 for the Primary road type section (the two-lane roads) and 10.00 for the Secondary road type section.
-
Check the box Use Destination Percentages and add the same percentages as step 2 for the Primary and Secondary road type sections.
The Diagonal centroid should match the screenshot below.
Exercise 11. Creating OD Matrices
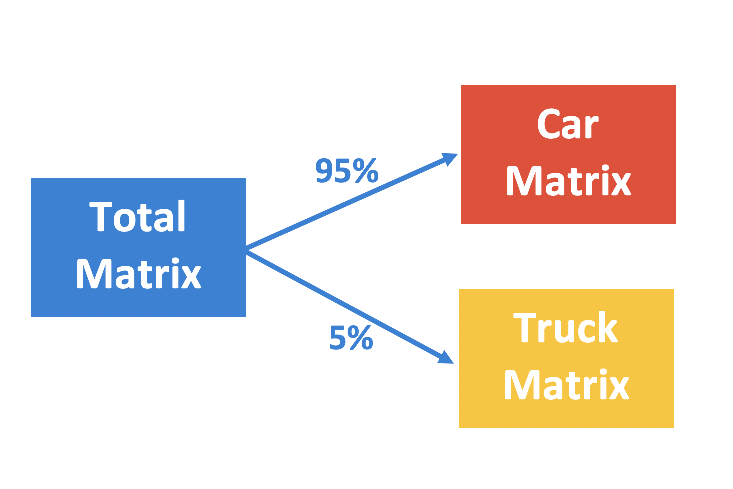
In this exercise we will create the OD matrices for using with the new centroids. We will begin with one matrix, named Total Matrix, from which we will extract two more matrices: Car Matrix and Truck Matrix. We will estimate that 95% of the trips in the first matrix are trips by car and the remaining 5% are trips by truck.
To create the first OD matrix:
-
In the Centroid Configurations folder, right-click Centroid Configuration > New > OD Matrix. A new OD matrix is added below the centroid configuration in the OD Matrices folder.
-
Open the new OD matrix and name it Total Matrix.
-
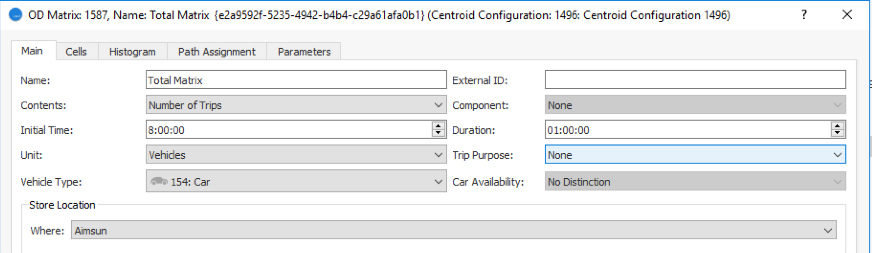
On the Main tab, select the data as displayed below.
-
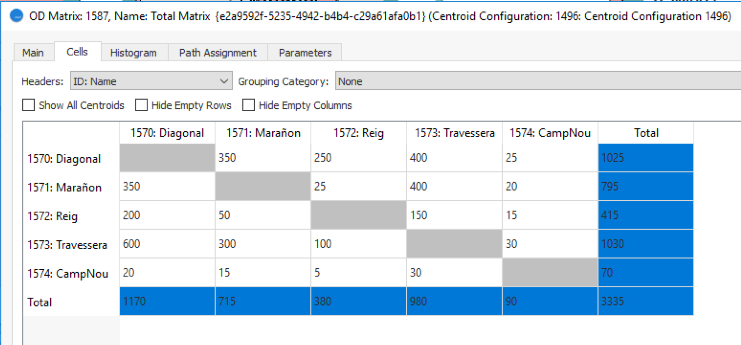
Click the Cells tab and enter the data in the screenshot below. To enter values in a cell, click once in the cell and type the amount.
-
In Headers, make sure that ID: Name is selected. This will identify the rows and columns by the names of the centroids we added in Exercise 10.
The next task is to extract the two car and truck matrices from Total Matrix. We can do this by using the Split option.
To extract the OD matrices:
-
Open Total Matrix.
-
Click the Cells tab.
-
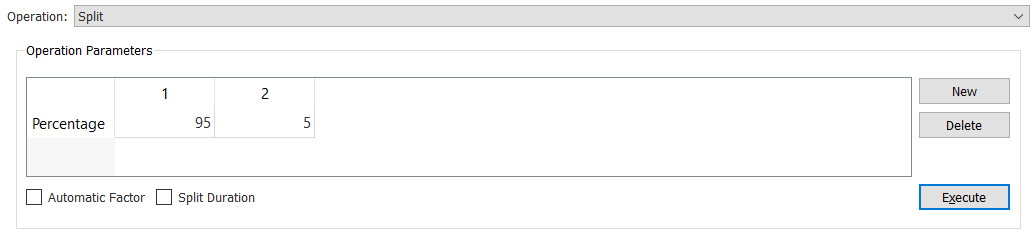
In the Operation field, select Split.
-
Click New to add a second Percentage option under Operation Parameters.
-
Click into each Percentage box and enter 95 and 5 as shown below.
-
Click Execute to make the split.
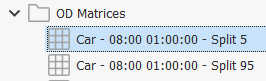
Two new OD matrices appear in the Project folder, indicating the percentage of split.
 "")
"") -
Open the – Split 5 matrix, change its Name to Truck Matrix, and change the Vehicle Type to Truck.
-
Click on the – Split 90 matrix, press F9 and rename it Car Matrix.
Exercise 12. Adding Traffic Demand
In Aimsun Next, traffic demand is an object that contains the demand for a model. The demand can be represented as either a traffic state, or as a set of OD matrices.
In this exercise we will create two traffic demands: one that contains the traffic state we created earlier; the second to contain the two OD matrices we created. In the scenario we will use to simulate the model, we will select which traffic demand to use.
First, create two Traffic Demand objects by selecting Project > New > Demand Data > Traffic Demand. These objects will appear in the Project window, in the Traffic Demands folder.
12.1 Adding OD Matrices to a Traffic Demand
To add OD matrices to a traffic demand:
-
Open one of the traffic demands and rename it Traffic Demand Matrix.
-
For Type select Matrices.
-
Click Add Demand Item
-
From the Select Object of Type dialog, tick Car Matrix and Truck Matrix and click OK.

-
Click OK to close the Traffic Demand dialog.
Adding a Traffic State to a Traffic Demand.
To add a traffic state to a traffic demand:
-
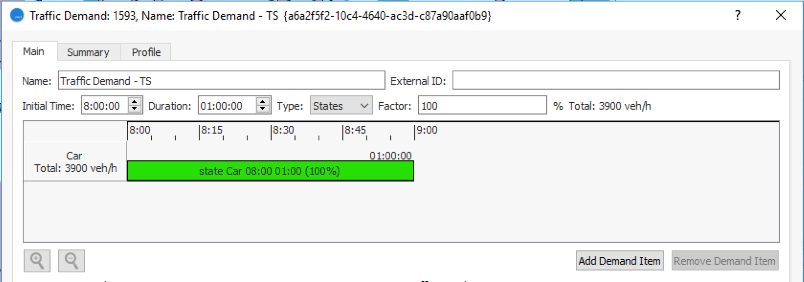
Open the second traffic demand and rename it Traffic Demand - TS. double-click on it and follow these steps:
-
For Type select States.
-
Set Initial Time to 08:00:00 and Duration to 01:00:00.
-
Click Add Demand Item.
-
From the Select Object of Type dialog, tick state Car and click OK.
-
Click OK to close the Traffic Demand dialog.
Exercise 13. Running a Simulation with Traffic Demand
In this exercise we will run a simulation to test the model so far. Later we will add signal control plans and transit.
To run the simulation we need to create a scenario and an experiment.
To create a scenario and experiment:
- Select Project > New > Scenarios > Dynamic Scenario. A new Dynamic Scenario is added to the Project folder inside the Scenarios folder.
- Right-click Dynamic Scenario > New Experiment.
-
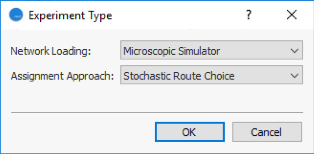
On the Experiment Type dialog, for Network Loading select Microscopic Simulator; for Assignment Approach, select Stochastic Route Choice.
-
Click OK. Micro SRC Experiment is added to the Scenario folder.
-
Open Dynamic Scenario and, for Traffic Demand, select Traffic Demand Matrix.

-
Click OK. We won’t discuss the features of experiments here, but to run the simulation we need to create a replication, which is the outcome from a single stochastic route choice (SRC) simulation.
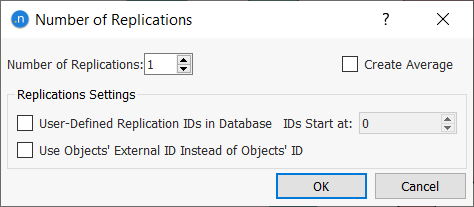
- Right-click Micro SRC Experiment > New > Replication.
-
On the Number of Replications dialog, untick Create Average (because this will be a single test run) and click OK.
-
Right-click Replication > Run Animated Simulation (Autorun). The simulation will start to run and the replication playback controls are displayed at the top of the window.
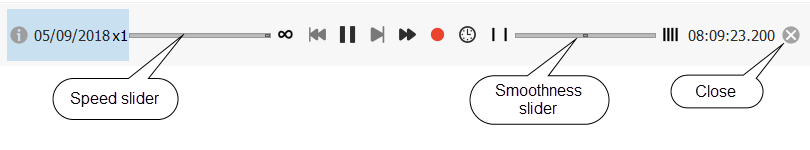
-
Try pausing and restarting the simulation using these controls. Use the sliders to adjust the speed and smoothness of the playback.
-
Pan and zoom around the 2D view to see the simulation in action. At the top of the 2D view, note that a View Mode of Simulated Flow has been automatically selected to visualize the outputs of the simulation.
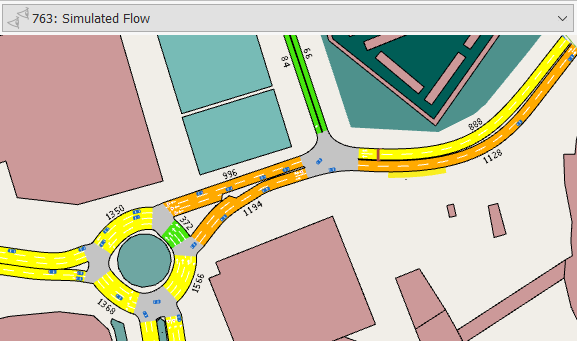
-
Close the simulation and change the View Mode back to None.
Exercise 14. Creating Signal Groups
Intersection 2 is to be controlled by traffic lights. The screenshot below shows where the five signal groups should be placed. Note that Signal P is a pedestrian crossing.

The first step is to create the signal groups.
To create signal groups:
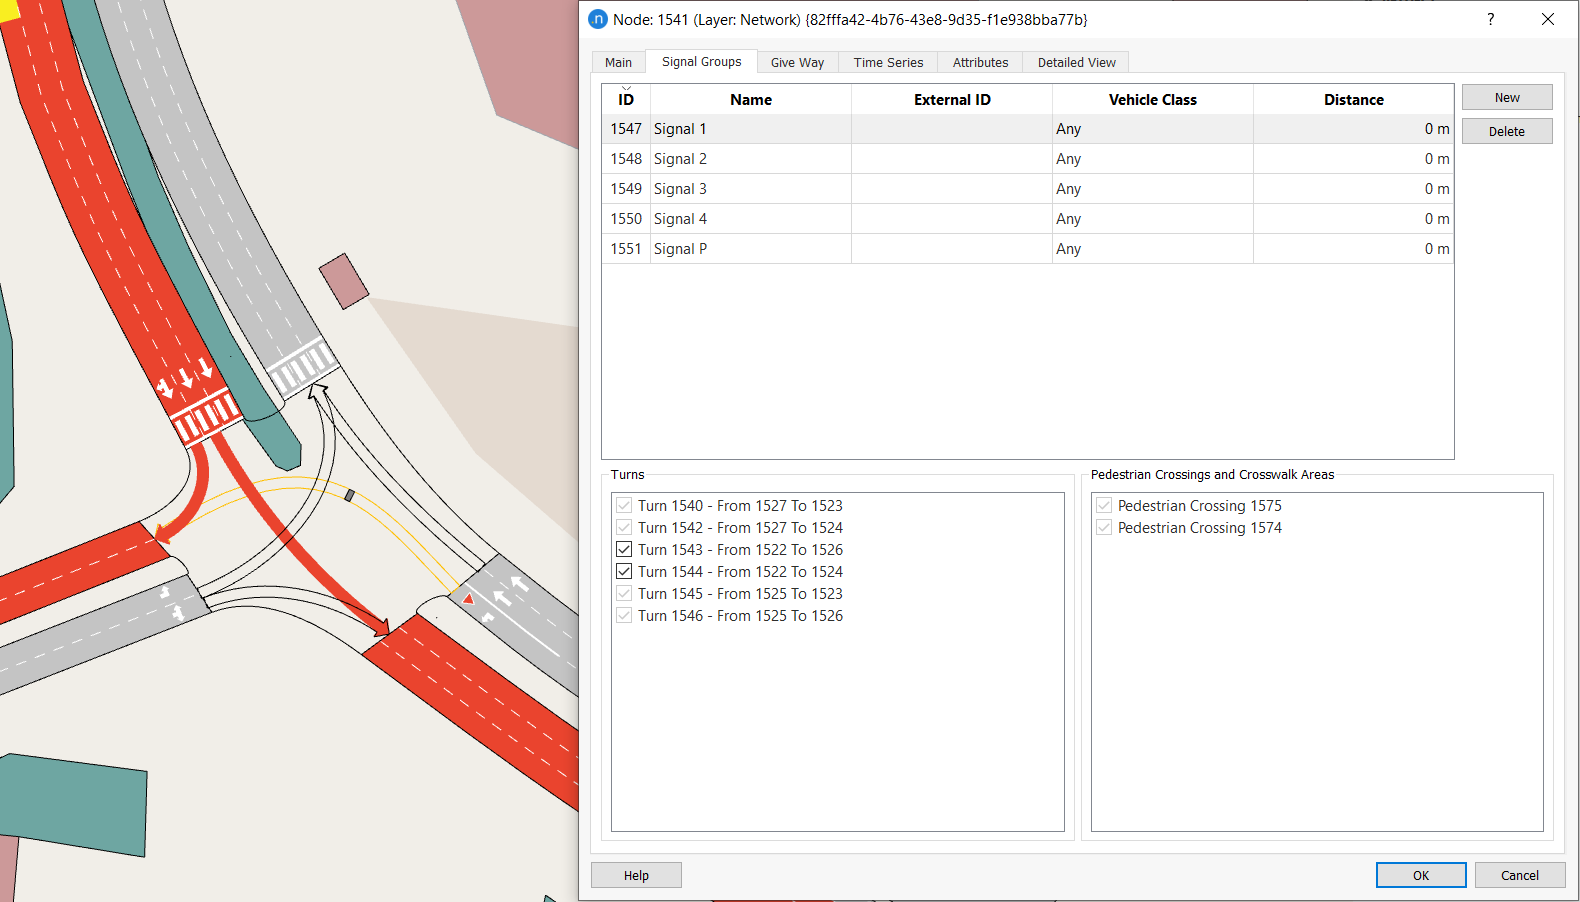
-
Double-click on the intersection/node and click the Signal Groups tab.
-
Click New, which adds the signal group identifier Signal 1 to the list.
-
In the Turns group box, select the turns that belong to Signal 1. You can check them in the 2D view where they will be highlighted.
-
Repeat steps 2–3 for Signal Groups 1–4.
-
For the pedestrian crossing, click New and click in the Name cell. Enter the name Signal P.
-
In the Pedestrian Crossings and Crosswalk group box, tick the two Pedestrian Crossing options.
-
Click OK to close the dialog.
Exercise 15. Creating a Control Plan and Signal Phases
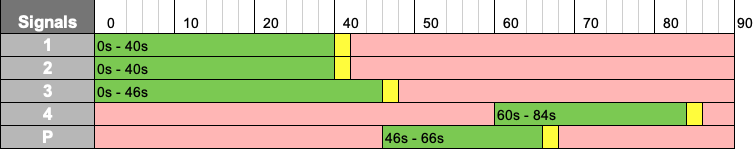
Now that we have created the signal groups and specified the turns they affect, we can create a control plan to hold their signal phases. In doing so we will apply the timings shown in the table below. The timeline at the top is marked in seconds.
To create a control plan:
-
Select Project > New > Control > Control Plan. A new Control Plans folder is added to the Project folder, containing the newly created Control Plan.
-
Open the Control Plan and change the Name to Control AM to distinguish it from a possible future plan (perhaps for the PM peak).
-
Set the Initial Time as 08:00:00 and click OK.
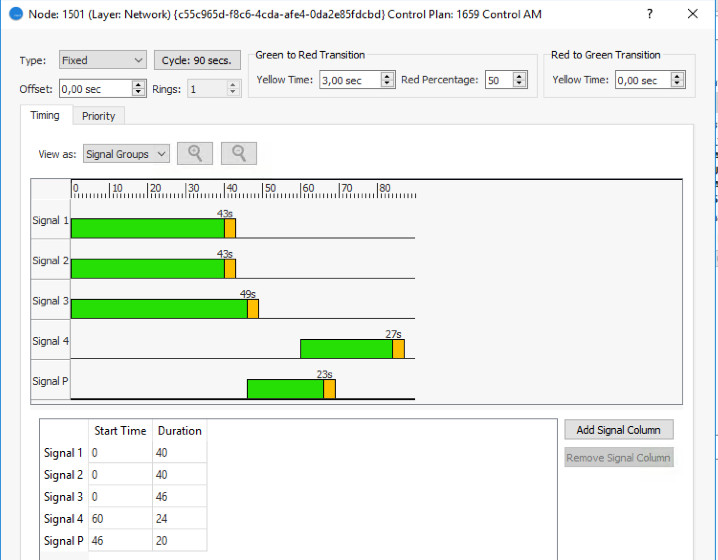
To edit the control plan:
-
Right-click on the intersection/node and select Edit Control Plan > Control AM.
-
From the Type drop-down list, select Fixed.
-
Set Yellow Time as 3.00 sec.
-
Change View as to Signals Group mode.
-
In the bottom panel of the dialog, which lists the signal groups we defined earlier, enter values for Start Time and Duration for each group, as illustrated below.
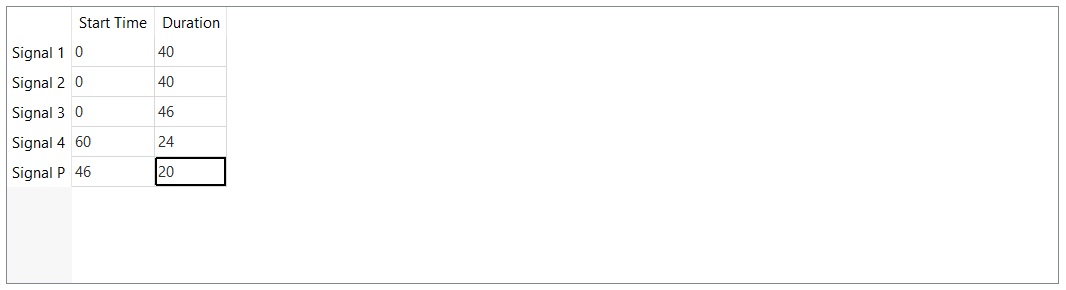
As you enter these values, the signal phases will be added to the upper part of the dialog.
Blank spaces between phases are considered to be interphase periods. In this case, they are 6 seconds long. Yellow time is taken as the first 3 seconds of the interphase.
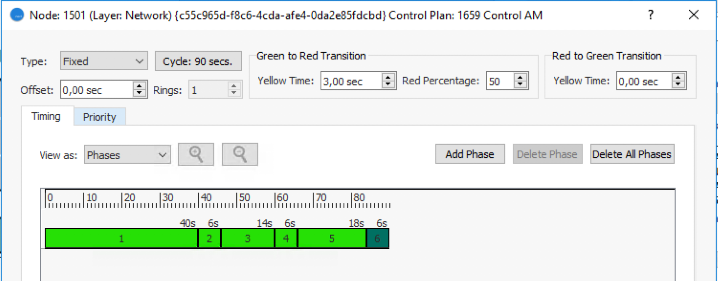
-
Change View as to Phase mode to see the phases arranged sequentially as shown below.
Exercise 16. Adding Meters
A meter is a tool that controls access to parts of a network. They are used, for example, to control traffic using on-ramps, for tolls, and for controlling entrance to certain zones.
In this exercise, we will control access to the Camp Nou grounds, requiring that each vehicle stops for approximately 10 seconds.
To add a meter:
-
Click
 and then click on the section where the access control is required (shown below).
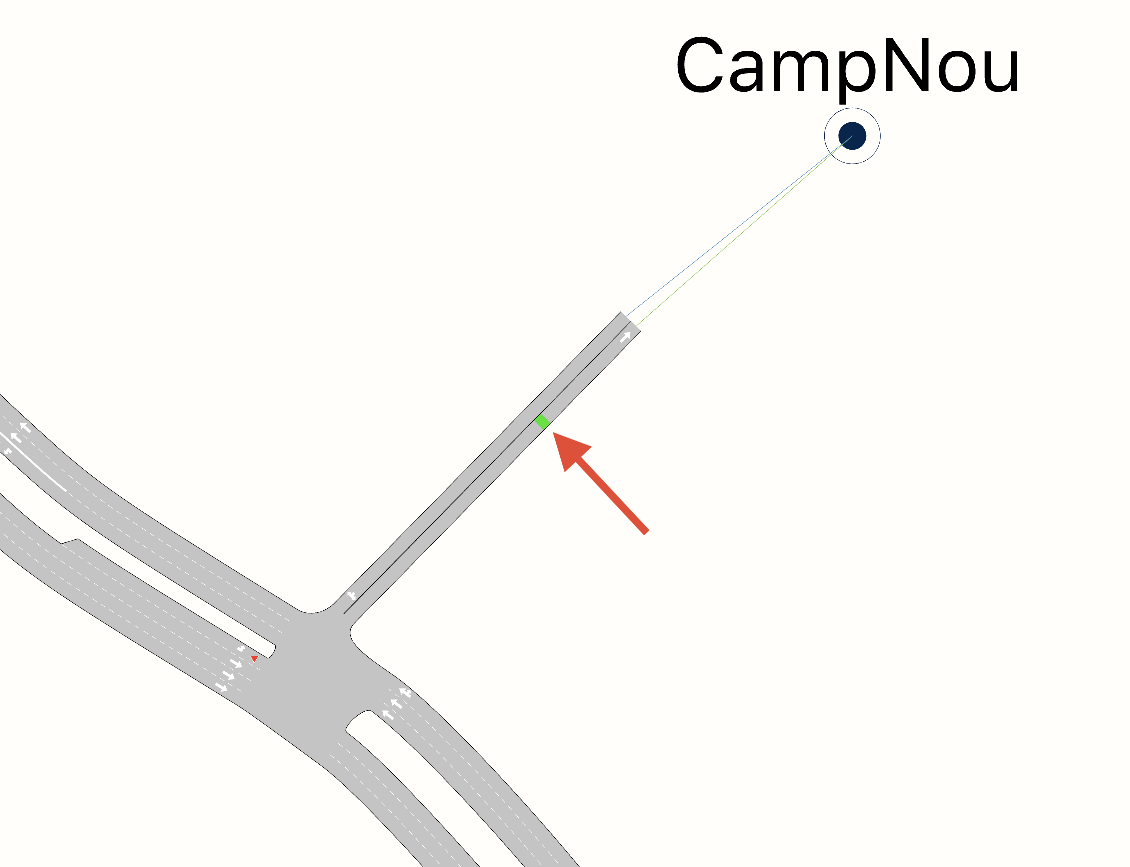
-
Double-click on the meter and, for Type, select Delay.
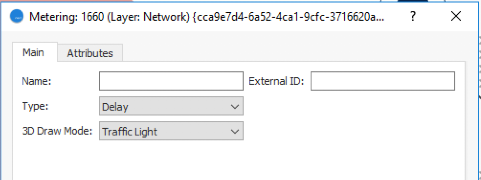
-
Click OK to close the meter.
-
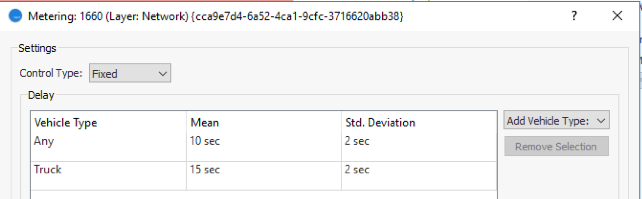
Right-click on the meter and select Edit Control Plan > Control AM.
-
For the Vehicle Type Any, enter a Mean delay of 10 seconds and a Std. Deviation of 2 seconds.
-
For Truck enter a Mean delay of 15 seconds and a Std. Deviation of 2 seconds. Trucks are generally treated differently from other vehicle types.
Exercise 17. Creating a Master Control Plan
A master control plan is a collection of control plans that are assigned to a scenario and used to control the signal plans within the scenario. Using a single master control plan eases the task of assembling different scenarios with different control options and of keeping those control options consistent.
To create a master control plan:
-
Select Project > New > Control > Master Control Plan.
-
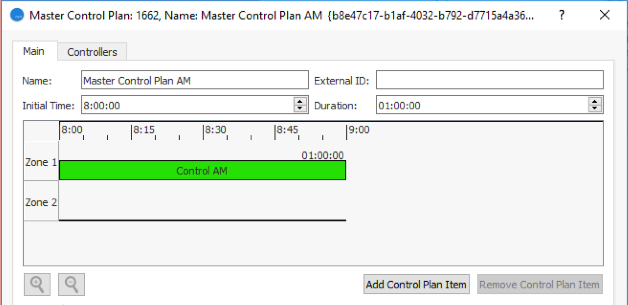
Open the master control plan and rename Master Control Plan AM.
-
Set the Initial Time to 08:00:00 (to match our earlier control plan Control Plan AM) and set Duration to 01:00:00.
-
To add the earlier control plan to this Master Control Plan AM click Add Control Plan Item and, on the Select Objects of Type dialog, tick Control Plan AM.
-
Click OK.
The master control plan should resemble the screenshot below.
Exercise 18. Running a Simulation with a Master Control Plan
Now we will include the master control plan and run a simulation with signal controls to observe how the signals work.
To run the simulation:
-
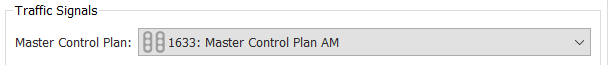
Open the dynamic scenario.
-
From the Master Control Plan drop-down list, select Master Control Plan AM.
-
Right-click Replication > Run Animated Simulation (Autorun).
-
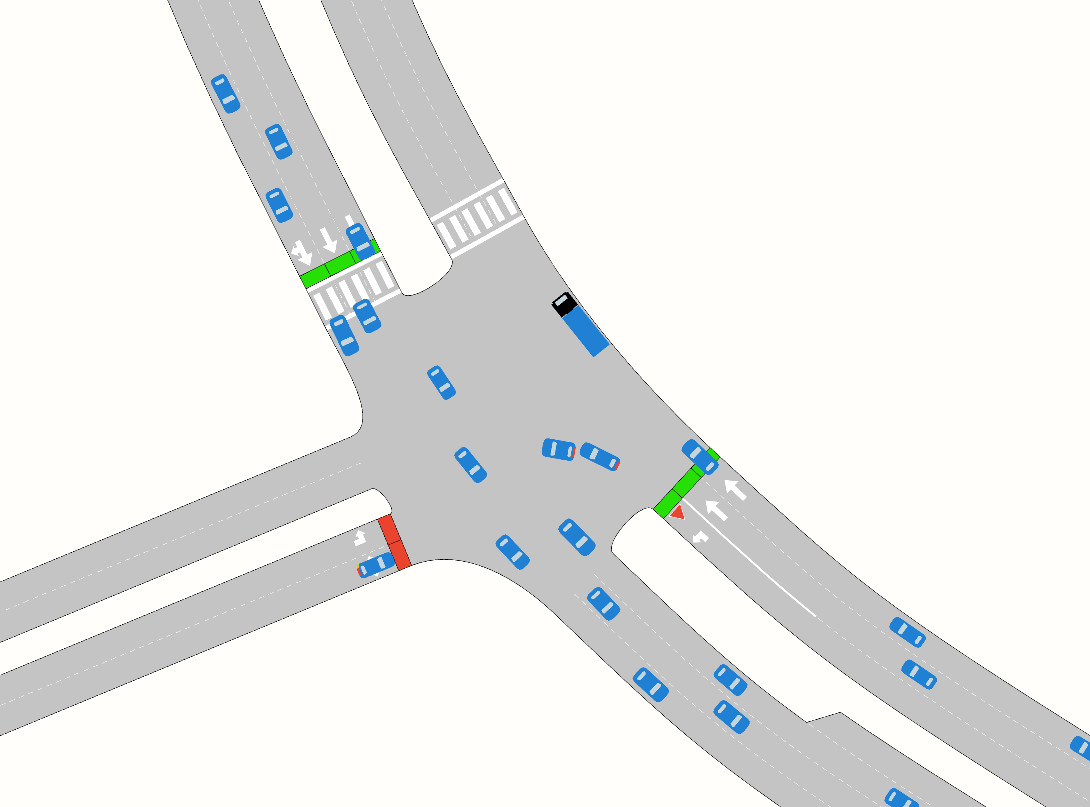
Pan and zoom to the intersection with signals and watch them at work.
Exercise 19. Defining a Reserved Lane
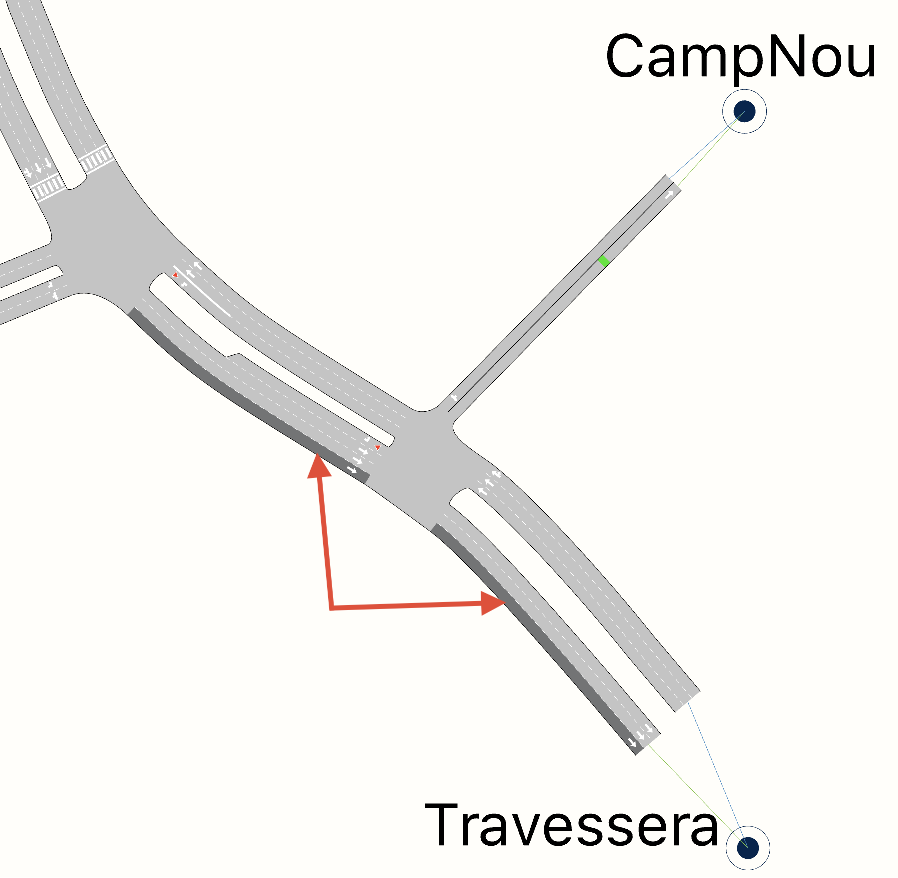
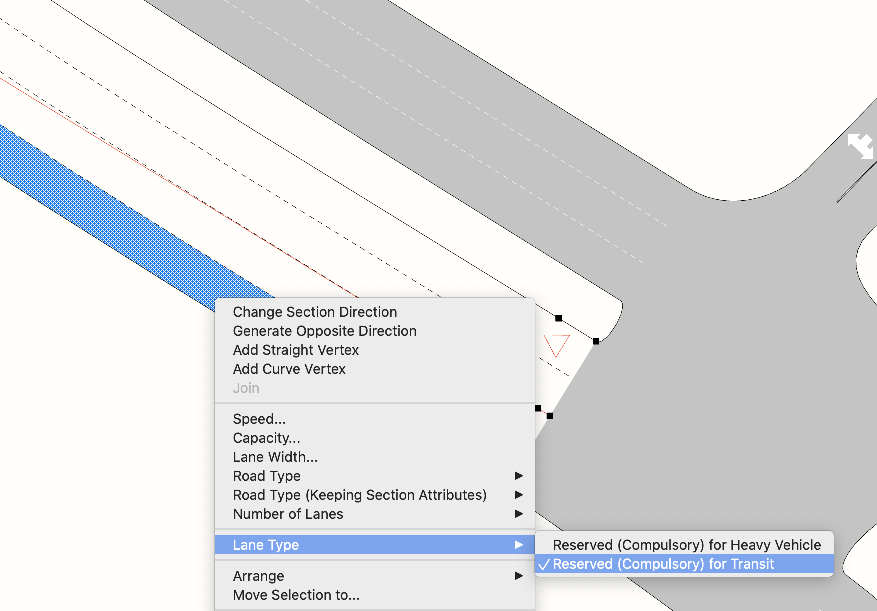
This exercise defines a reserved lane for the compulsory use of transit (in this case it is a bus lane). The screenshot below shows the location of the reserved lane, marked in dark gray, in the right-hand lane of two sections.
The Infrastructure folder in the Project folder contains two types of reserved lanes.
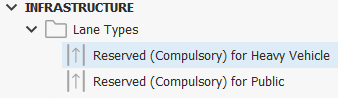
We will apply the type named Reserved (Compulsory) for Public to the sections illustrated above.
To define a reserved lane:
-
In the 2D view, find the first affected section and click to highlight it.
-
Right-click on the right-most lane (according to the direction of traffic) select Lane Type > Reserved (Compulsory) for Public.
-
Repeat steps 1 and 2 for the second section.
You can now see the reserved lane on both sections.
Exercise 20. Adding Bus Stops
In this exercise, we will add four bus stops to the network as shown in the screenshot below. As well as their locations, the screenshot shows the type of bus stop ('normal' or 'bay') plus the length of each stop in meters.

Use the screenshot above as a guide when following these steps.
To add a bus stop:
-
Click
 and then click on the lane of the section where you want to place the bus stop.
 -
Click on the bus stop and drag its vertices to change its physical length.
-
Double-click on the bus stop to open the Transit Stop dialog.
-
Enter a Name for the bus stop.
-
For Type, select either Normal or Bay.
Exercise 21. Creating Transit Lines and a Transit Plan
In this exercise, we will define three transit lines for buses, as shown in three different colors below.
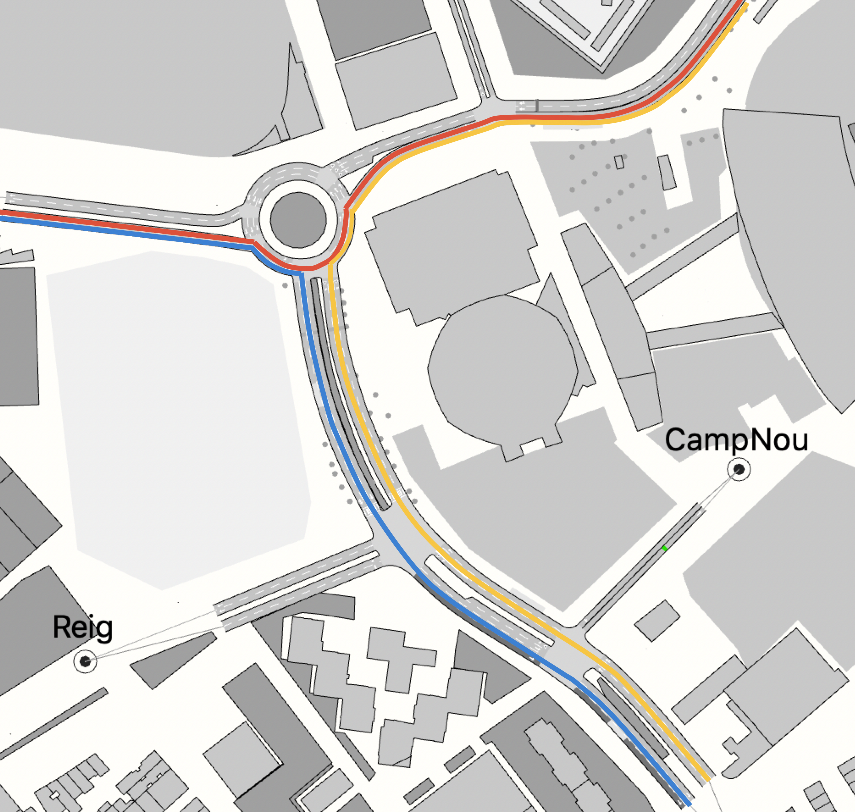
The table below contains all the required information about the transit lines, bus stops, departure intervals and stopping times. All lines run from 07:00–22:00 (15 hours).
Name        Bus Stops   Departure Time Interval (mean)  Stop Time (mean)
----------- ----------- ------------------------------  ----------------
L-Blue      Stop 1,2    5 mins                          20 secs
L-Red       Stop 4      6 mins                          24 secs
L-Yellow    Stop 3,4    5 mins                          20 secs
21.1 Creating Transit Lines
To create a transit line (L-Blue):
-
Select Project > New > Transit > Transit Line. A new transit line is added to the Transit Lines folder.
-
Open the new transit line.
-
Change its Name to L-Blue.
-
To specify the route, on the Main tab tick Edit Route and then select, one by one, all the sections of the bus route in the 2D view. The sections will be added to the dialog, as shown below.
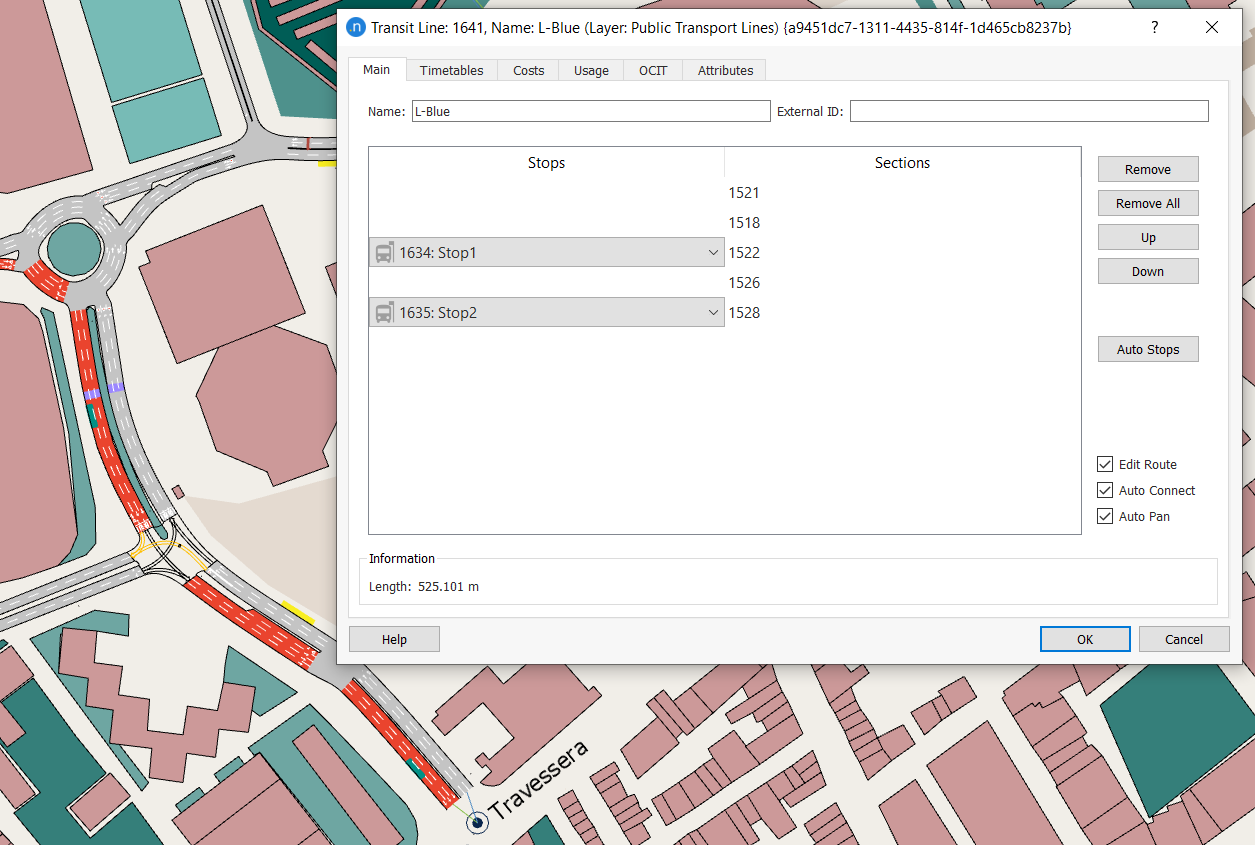
-
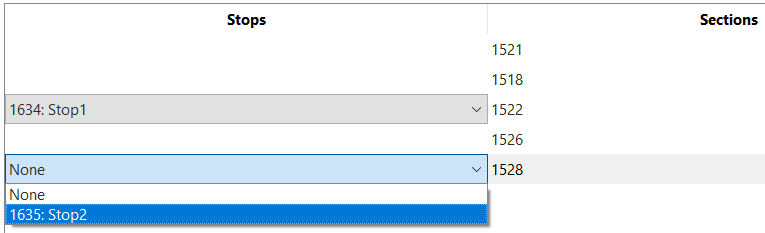
In sections where a bus stop belonging to the line is located, a drop-down list will appear to the left of the section number. From this drop-down, select the bus stop.
-
Click on the Timetables tab.
-
To the right of the Timetable field, click New.
-
In the Timetable field enter the name Weekday.
-
In the Schedules group box, click New and set Initial Time to 07:00:00, Duration to 15:00:00, and Departure Times to Interval (Punctual).
-
In the Departure group box, for Vehicle Type select Bus, and set Time Interval Between Departures as 00:05:00 (this corresponds to the third cell in the table above).
-
In the Dwell Times group box, enter the mean times for each of the bus stops on this line using the data from the table. You can enter values directly into the cells or you can click Set All Times and complete the Stop Times dialog.
At this stage the dialog should resemble the screenshot below.

-
Repeat steps 1–10 for the two remaining lines, L-Red and L-Yellow.
21.2 Creating a Transit Plan
When all the transit lines are ready, we must create a transit plan. A transit plan contains a set of transit lines and timetables and is the object included in the scenario in order to run transit in the simulation.
To create a transit plan:
-
In the Project folder, right-click Transit > New > Transit Plan. A new transit plan is added to the Transit Plans folder.
-
Open the new transit line.
-
Change its Name to Transit-Plan Weekday.
-
Assign the transit lines (and their corresponding timetables) to the plan. To do so, select one or more items from the transit Line Timetables column and click the green arrow icon
 to include your selection. The next image shows how the editor should look after assigning the three lines with their weekday timetables to the plan.
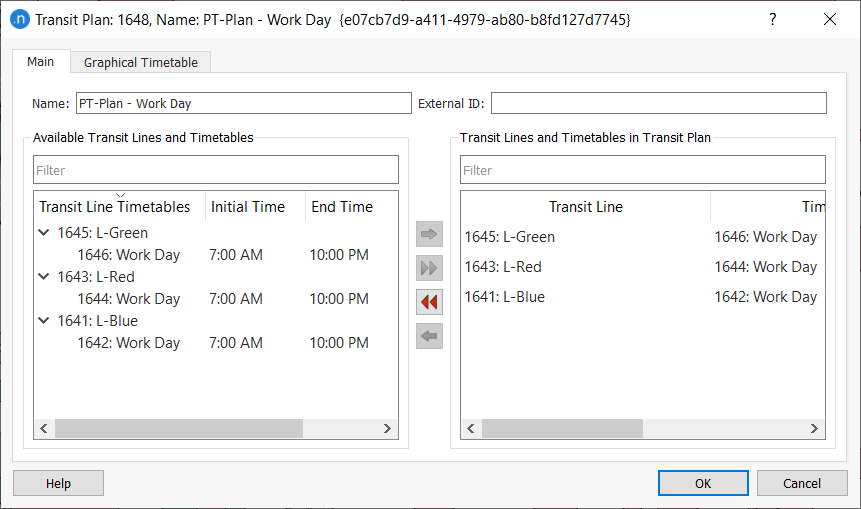
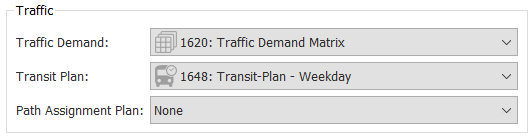
Exercise 22. Running a Simulation with Transit
In this exercise we will add the transit plan to the scenario and run the simulation again.
To run the simulation:
-
Open the dynamic scenario.
-
From the Transit Plan drop-down list, select Transit-Plan Weekday.
-
Right-click Replication > Run Animated Simulation (Autorun).
As before, explore the 2D view to see transit as part of the simulation.