Space Time Diagram
A space time diagram plots information from detectors in space and time where space is the distance along a motorway defined by an ordered set of detectors. The detector information is plotted in color on the 2D space time graph.
A typical use of a space time diagram would be to plot the average speed on a motorway section as the detected variable to show the time. location and subsequent propagation and dispersal of congestion on the motorway.
Space Time Diagram
Selecting Data Analysis > Space Time Diagram when an animated microsimulation is running brings up the following dialog.

The Space Time Dialog specifies the detectors in a detector set, the dynamic ranges used in allocating colors and the space time view itself.
Detector Sets Tab
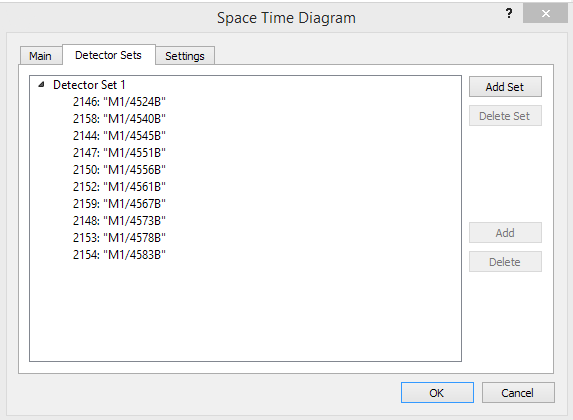 A Detector Set is an ordered collection of detectors. To add or delete a set, click the Add Set or Delete Set buttons. With the set selected, click on a single detector in the 2D View or click a section. If a section is selected, all detectors of the section will be added to the current selected set and sorted by their position in the section.
Click over any added detector and press Delete Set button to remove the detector from the set.
Click the Delete button to remove the currently selected detectors from the set.
Settings Tab
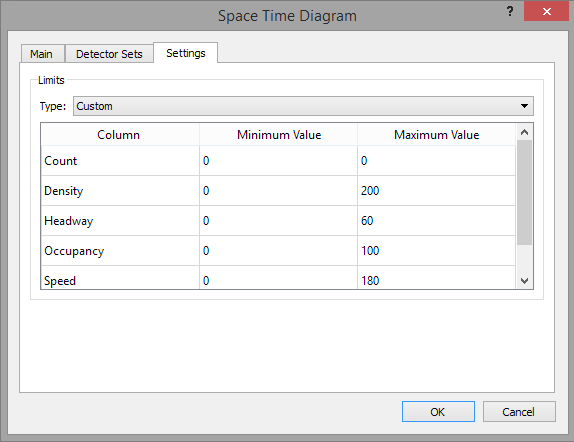
The Settings tab is used to set the ranges for the dynamic variables in the graph. The ranges can be customized, or the Dynamic Values option automatically set to appropriate ranges.
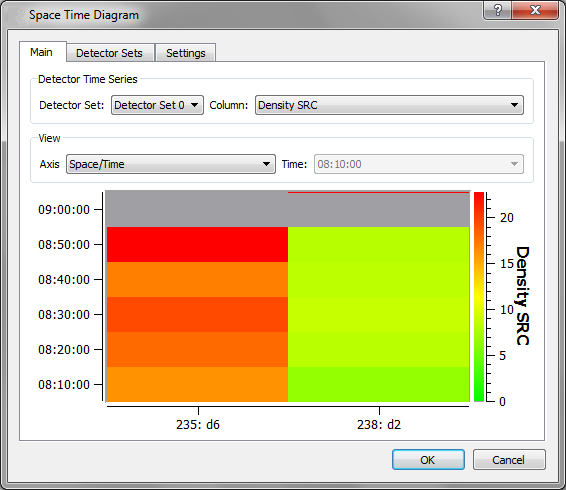
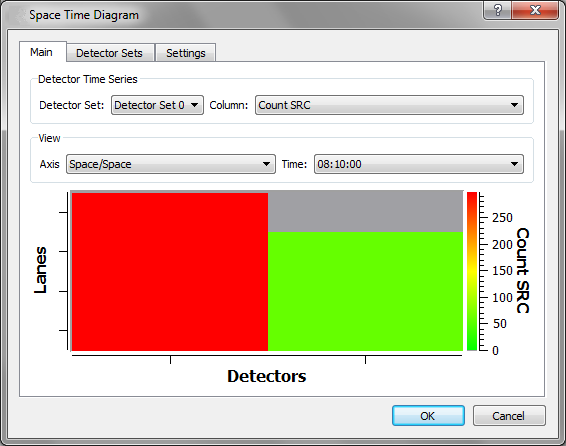
Main Tab
The main tab shows the space time plot. The options are:
- Detector Set: Which set to use.
- Column: Which variable to show
- Space Space Diagram The X Axis represents the detectors ordered by position. The Y Axis represents the lanes of the section. Following figure shows the Count (SCR) at time interval 08:10:00.
- Space Time Diagram* The X axis represents the detectors ordered by position. The Y axis represents the simulation time.
Automatic Detector Creation
Creating the sections at fixed intervals on a motorway is a repetitive task and hence one which can be automated with a script. This is an example of Python Script, which creates a detector at each lane at a regular distance on a section (in the code, the "target" variable is the section). The script must be added to the section's context menu and executed to generate the detectors.
sectionType = model.getType("GKSection")
distanceBetweenDetectors = QInputDialog.getDouble(None, "Input Dialog", "Distance Between Detectors", 50)[0]
if target != None and target.getType().inherits(sectionType) != 0:
    sectionLength = target.length2D()
    currentLength = 0.0
    nbLanes = target.getDataValueIntByID(GKSection.nblanesAtt)
    while currentLength < sectionLength:
        i = 0
        for i in range(0, nbLanes):
            detector = GKSystem.getSystem().newObject("GKDetector", model)
            detector.setPosition( currentLength )
            detector.setLength( 4.5 )
            detector.setLanes( i, i )
            target.addTopObject( detector )
            model.getGeoModel().add( target.getLayer(), detector )
        currentLength = currentLength + distanceBetweenDetectors
    print "Done"
print
    "Script must be launched from a section's context menu"