Table View
Aimsun Next provides a method of accessing and modifying object data via a table interface.
- Open this Table View by selecting Window > Windows > Table View.
- You can also click into the 2D view and type the shortcut letter "t".
The Table View is displayed at the bottom of the 2D view. The following screenshot shows the Table View window alongside the Log window.
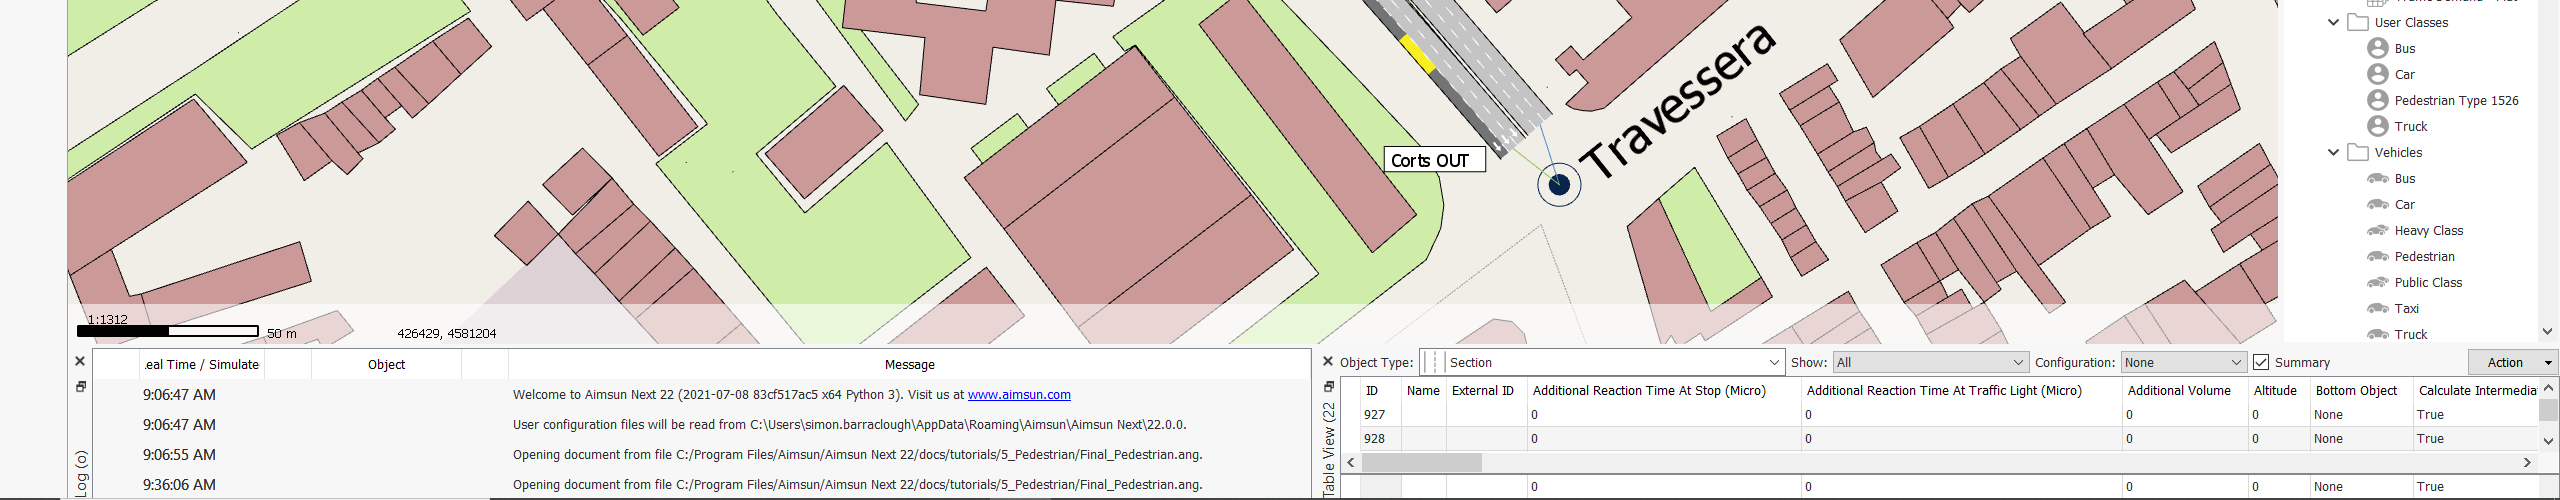
You can temporarily close the Log (or other) windows to make more of the Table View visible and you can expand the Table View vertically by manually dragging its upper border.
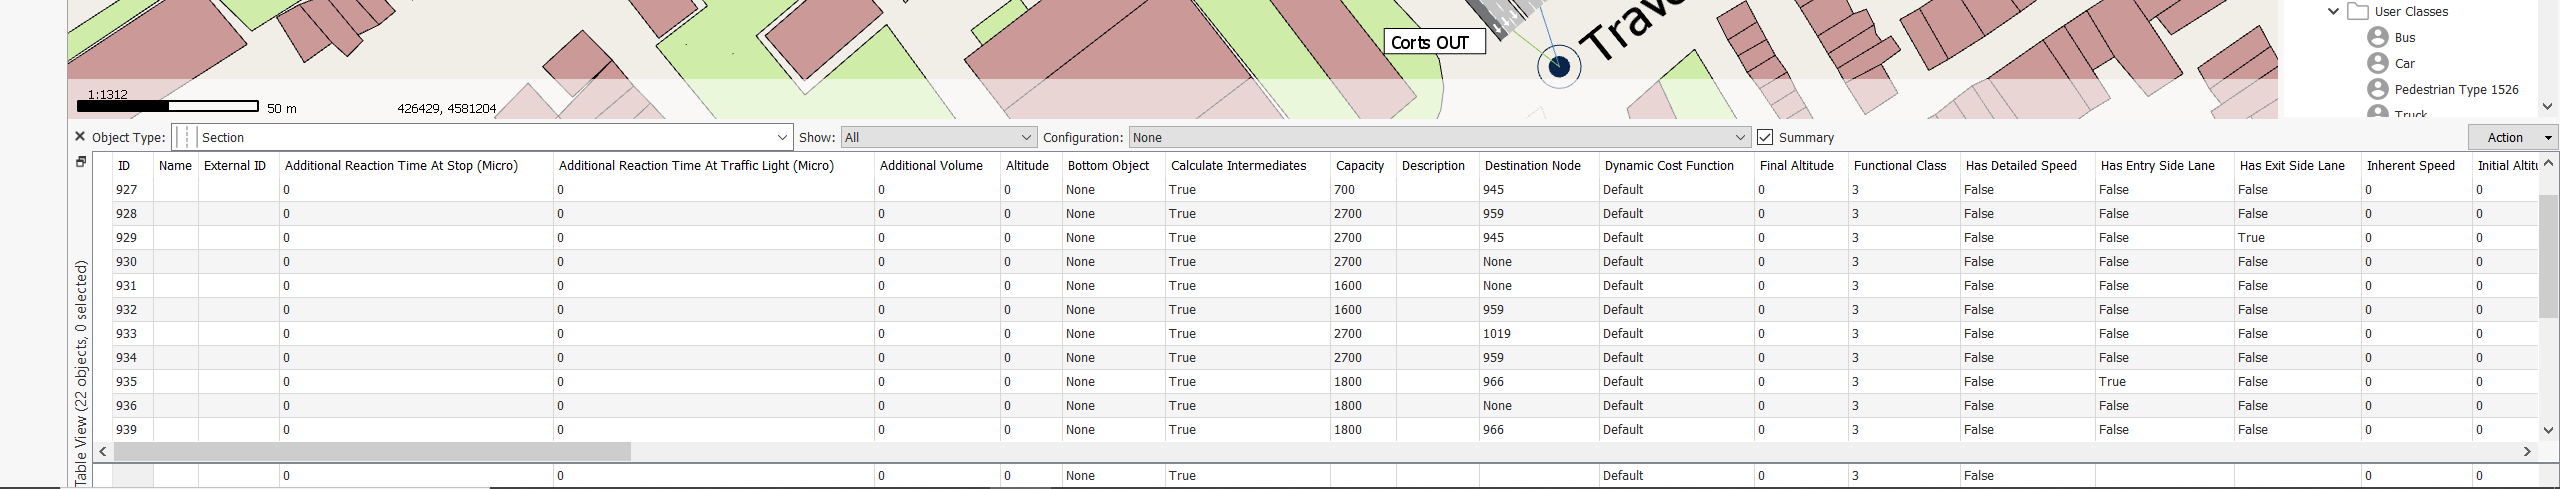
Table View
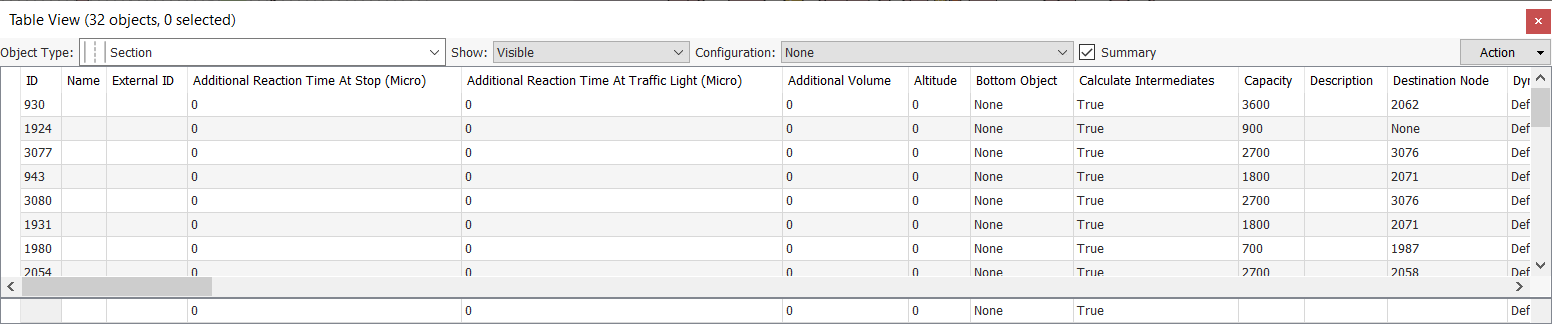
On a regular Table View, there are four main interaction areas from left to right across the top of the table: Object Type, Show, Configuration, and Action. These function as drop-down menus.
- Object Type: Select which type of object you want to list in the main Data View. You can begin typing into the field to avoid or speed up scrolling. For example, type "ce" to highlight Centroid, Centroid Configuration, etc.
-
Show: Refine which objects of the current pre-selected type should be shown in the Data View from the following options.
- All: Shows all the objects of the current type.
- Selected in View: Shows the objects of the current type that are selected in the 2D view.
- Visible: Shows the objects of the current type that are currently visible in the 2D view. This list can change when you pan or zoom around the 2D view.
- Filtered: Defines a filtering condition to specify which objects of the current type should be shown.
- Filtered and Selected in View: Defines a condition to filter which of the objects of the current type that are also selected in the current view should be shown.
-
Configuration: Selects a Table View configuration to use.
- Action: The Action drop-down contains the following options.
- Column Visibility: Specifies which columns to show.
- Save Configuration: Saves the current Table View configuration. The Saving Table Configuration dialog enables you to enter a name for the saved configuration.
- Delete Configuration: Deletes saved Table View Configurations. The Delete Configuration dialog prompts you to choose a configuration to delete.
- Copy: Copies data from either the Data View or the Summary View if the Summary box is ticked.
Data View
The Data View is the main part of the Table View. It is a table where each row represents an object of the specified type and each column represents a property of the type.
Some columns of the Data View are editable and some might not be. For example, the number of Connections that a Centroid has cannot be edited in the table but the Brush Style of a Polygon can be edited.
When a value is editable, double-click in the appropriate cell to display a suitable editor for the data. Press Enter to finish modifying data.
When you select an object in the Data View, it will be highlighted in the 2D view if it is a viewable object.
Double-click the ID of an object to center it in the 2D view. Again, this only applies if it is a viewable object.
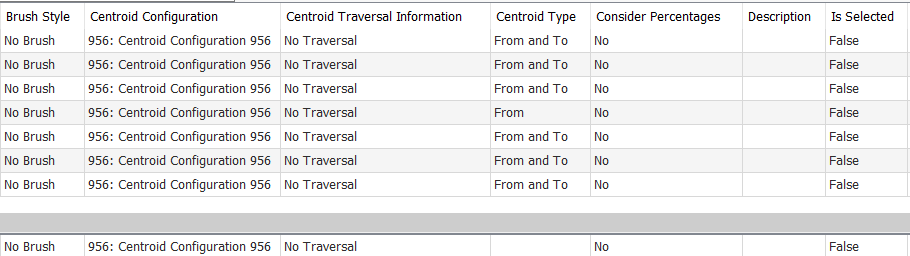
Summary View
The Summary View shows the data that are common to all the objects currently listed in the Data View. Tick the Summary box to activate it. It appears as a row at the very bottom of the Table View.
There is a good chance that not every cell will contain data because some data will not be common across all objects. The screenshot below shows a section of the table with the Summary row at the bottom.
Changing the value of a cell in the Summary View changes that value for all objects currently listed in the Data View.
Filtering
Table View provides filtering options to fine-tune and restrict the objects listed in the Data View. Filtering works with particular attributes of the currently specified Object Type. There are seven different filtering methods for an attribute, as listed.
- = The value of the attribute must be equal to the given value.
- ≠ The value of the attribute must be different from the given value.
- > The value of the attribute must be greater than the given value.
- < The value of the attribute must be less than the given value.
- ˜ The found value must match the given regular expression.
- [] This is a range and a second field appears. The value of the attribute must be within the range between the two values.
- All Every type of value is accepted.
Filters can be combined with a logical AND or OR operation. Select the option None to indicate this is the last filtering clause.
Column Visibility
Object Types often have many attributes and sometimes it is more useful to show a reduced set of them.
- Select Action > Column Visibility to choose which to show and which to hide. The Column Visibility dialog is displayed
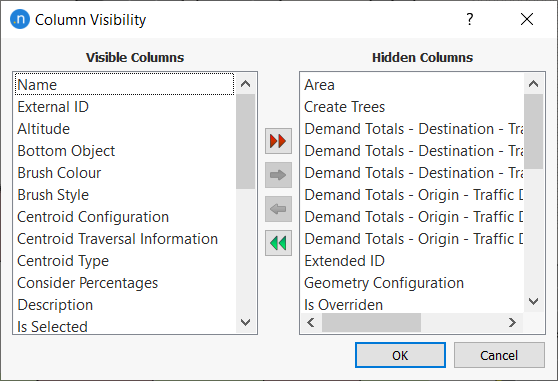
- Select items in Visible Columns and move them to Hidden Columns using the selection arrows (red to move right, green to move left; double arrows move all items right or left).
- Click OK.
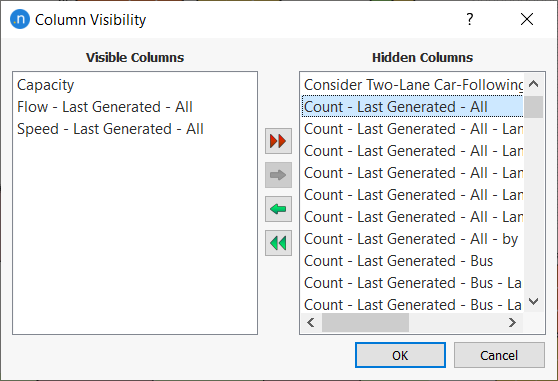
Time Series Columns
After running a simulation, or any of the processes that generate outputs, a set of attributes becomes available for objects that can generate time series data. These are initially hidden columns but you can move them to Visible Columns as described in Column Visibility.
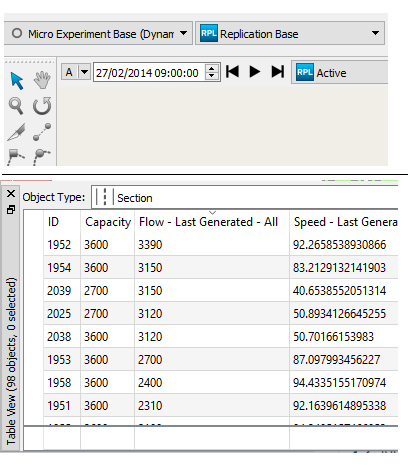
The data in these columns show the values of the attributes that correspond to the time interval selected in the time selection widget of the main viewing window. Move forwards and backwards through the time series data by selecting the time interval using this widget.
Configurations
Configurations are predefined queries for the Table View. A saved configuration stores:
- Object Type
- Visible columns
- Show mode
- Filtering options
You can save and delete Configurations using options on the Action menu. Change the current configuration by selecting from the Configurations drop-down list.