Centroid Vectors
Centroid Vectors contain a value per Centroid and are used in adjustment scenarios to provide trip totals, confidence values, parking availability, and costs, or other data specified by centroid.
Centroid Vectors are created from their Centroid Configuration in the project window.
Centroid Vector Editor
The Centroid Vector editor can be opened by double-clicking on the Centroid Vector in the Project Window or accessing Properties in its context menu.
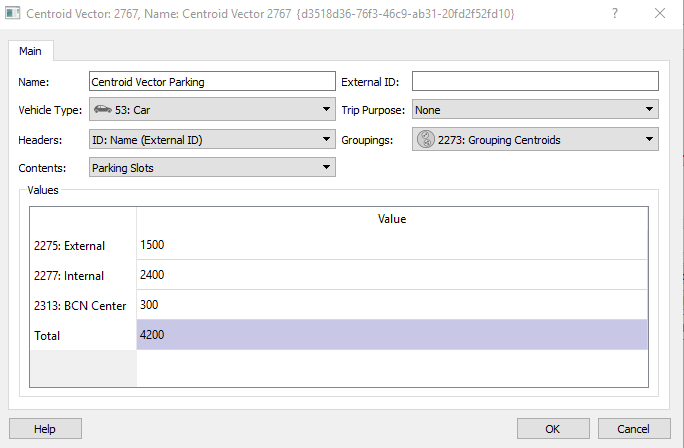
The editor specifies the vehicle type and purpose for the vector, and if clusters of centroids are used, the grouping to be applied to specify the cluster. The content of the vector is selected and the values entered via the table.
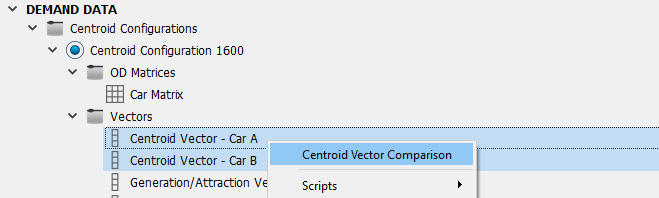
Centroid Vector Comparison
Two centroid vectors can be compared to reveal and analyze the differences between them. If two (and only two) centroid vectors are selected in the project window, the context menu will contain a Centroid Vector Comparison option. Centroid Vectors can be of any type, purpose, etc. though only vectors of the same type should be compared.
Select two Centroid Vectors, either by SHIFT and click to select adjacent vectors or CTRL and click to select two individual vectors. Right-click and select Centroid Vector Comparison in the context menu.
The Centroid Vector Comparison dialog shows the differences between the two vectors, cell by cell, as an absolute value and a relative percentage. Selecting a line in the table highlights the centroid values.
If a Centroid Grouping Category with Groupings has been created, the differences can be aggregated by Grouping pairs, that is, by comparing the two centroid vectors aggregated by Groupings in that Grouping Category.
Results can also be filtered by Grouping, to show just those centroids inside that single centroid grouping.
The results can be viewed as a graph and can also be exported for further analysis as a table or as an image of the graph.