HCM Algorithms
The FHWA Highway Capacity Manual published in 2010 contains guidelines for the use of simulation tools in assessing the performance of highway facilities. An important part deals with the comparison of performance measures from different traffic analysis tools.
After proving that vehicle trajectory analysis is the only approach to develop performance measures that are consistent with HCM definitions, with field measurement techniques, and with other simulation tools, Chapter 24 of the HCM presents a set of computational procedures that can be applied “on the fly” during the simulation.
Aimsun Next implements these algorithms "on the fly" – as the simulation proceeds to provide HCM compatible outputs without the need for post processing of vehicle. The algorithms used to produce these outputs are described here.
Computational procedures
The following procedures are aimed at producing performance measures that are compatible with the HCM’s deterministic procedures, are based on trajectory analysis and are designed to be implemented as step-by-step computations during the simulation.
Note: Density (PCU/mile) is calculated per lane, not section. Because a section can contain two or more lanes, please be aware of the impact of the number of lanes on the output value. For example, a single vehicle in a kilometer-long section with three lanes would return a density value of 0.33.
Outputs
There are two types of trajectory analysis:
- Longitudinal analysis, which consists in following individual vehicles over time steps as they travel through a link
- Spatial analysis, which consists in considering at the same time all the vehicles that are in a link at a time step
In terms of output calculation during the simulation:
- Longitudinal analysis computes for each vehicle in a link during each time step measures, cumulating them for all the time steps required to traverse the link, and then aggregating for all the vehicles that exit from the link during a statistics interval
- Spatial analysis computes for each link and for each lane during each time step measures that involve all the vehicles present, and then aggregating for all the time steps during a statistics interval
The outputs related to longitudinal analysis are:
- Segment delay [s/veh]
- Queue delay [s/veh]
- Stopped delay [s/veh]
- Number of stops
The outputs related to spatial analysis are:
- Density [PCU/mi per lane]
- Average queue length [veh]
- Average back of queue [m]
- Maximum back of queue [m]
- Percent queued vehicles [%]
- Percent overflow [%]
- Percent slow vehicles [%]
Definitions
The following definitions are aimed at determining the state of a vehicle during a time step (e.g. stopped, queuing, etc.).
Definitions for stop-related measures
A vehicle reaches the stopped state if its speed is less than 5 mi/h. A stopped vehicle leaves the stopped state when:
- For stop delay computation, its speed is greater than or equal to 5 mi/h
- For number of stops computation, its speed is greater than or equal to 1/3 of its desired speed
Definitions for queue-related measures
A vehicle reaches the queuing state of a link either when:
- The gap with its leader is less than or equal to 20 ft
- AND its speed is greater than or equal to the leader’s speed
- AND its speed is less than or equal to 1/3 of its desired speed
OR when (first vehicle to arrive at the stop line):
- No leader is present on the link
- AND its distance to the stop line is less than or equal to 50 ft
- AND it is decelerating or it is stopped
A queuing vehicle leaves the queuing state (of a link) either when:
- its speed is greater than or equal to 2/3 of its desired speed
- AND its speed is lower than or equal to the leader’s speed OR it doesn’t have any leaders
OR when (first vehicle in queue):
- It exits from the link
The analysis is done on a link-by-link basis. Each link has its own queue. If a queue extends over several links, each has a separate queue that can extend at maximum from the exit to the entrance. If the queue is spilling back from the downstream link, it will concurrently leave the queuing state of the current link and join the queuing state of the downstream link.
Other definitions
A vehicle is in the following state when:
- The gap between its front bumper and the rear bumper of its leader is less than or equal to 3s
- AND the difference between the leader’s speed and its speed is less than or equal to 12 mi/h
Computation
Computing the outputs is based on determining the state of each vehicle at each time step and performing the relevant calculation.s Note that a vehicle can be both stopped and queued at the same time; in this case, both its queue and its stopped calculations have to be updated.
Delay-related measures
Time step delay is required as an intermediate measure to compute the three delays listed below: It is defined for each vehicle and each time step as: The duration of the time step minus the time it would have taken the vehicle to cover the distance traveled in the step at its desired speed.
Segment delay for each vehicle; the sum of the time step delays while it is on a link. Alternatively, it can be computed without accumulating individual time steps as: exit time, minus entrance time, minus time it would have taken the vehicle to traverse the link at its desired speed.
Queue delay: for each vehicle and each time step; the time step delay if the vehicle is in the queuing state; otherwise, 0. It is accumulated over all the time steps while the vehicle is on a link.
Stopped delay: for each vehicle and each time step, it is the time step delay if the vehicle is in the stopped state; otherwise, it’s 0. Then it is accumulated over all the time steps while it is on a link.
These provide segment, queue, and stopped delay for an individual vehicle while it is on a link. The output for a time interval and for a link is computed by averaging for all the vehicles that exit from the link during the interval, i.e. adding the individual vehicle delays and then dividing by the number of vehicles that exit from the link during the interval.
The LoS for each approach of a signalized intersection must be determined based on the queue delay, according to the ranges in the following table.
| Level of Service | Queue delay (s/veh) |
|---|---|
| A 1 | ≤ 10 |
| B 2 | >10 and ≤20 |
| C 3 | >20 and ≤35 |
| D 4 | >35 and ≤55 |
| E 5 | >55 and ≤80 |
| F 6 | >80 or Q/C>1 |
The LoS for the intersection is based on the average of the queue delay of the approaches, weighted by the flow of each approach, according to the ranges of the same table.
The LoS for each approach of a yield or stop-controlled intersection, including a roundabout, must be determined based on the queue delay, according to the ranges in the following table.
| Level of Service | Queue delay (s/veh) |
|---|---|
| A 1 | ≤ 10 |
| B 2 | >10 and ≤15 |
| C 3 | >15 and ≤25 |
| D 4 | >25 and ≤35 |
| E 5 | >35 and ≤50 |
| F 6 | >50 or Q/C>1 |
The approach defined in HCM Chapter 18 as extends the queue assessment backward from the stop line a sufficient distance to include the maximum queue during the study period, and in any case at least 250ft. At the same time, HCM Chapter 24 says that if a delay is caused by a queue spilling back from a downstream intersection, the delay is assigned to the upstream approach.
Therefore, theoretically, the upstream end of an approach is:
- Max(250ft, Min(MaxBOQ, upstream intersection)).
Aimsun Next only calculates the basic case, in which the approach is equal to the section entering into a node.Where the intersection is more complex, users can need to customize the measurement using scripting to derive the LoS
The LOS for the intersection is based on the average of the queue delay of the approaches, weighted by the flow of each approach, according to the ranges of the table.
Stop-related measures
Number of stops: each time a vehicle reaches the stopped state, its number of stops is incremented by:
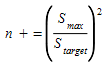
Where:
- S~max~ is the maximum speed reached since the last stop
- S~target~ is its desired speed.
This provides number of stops for an individual vehicle while it is on a link. The output for a time interval and for a link is computed averaging for all the vehicles that exit from the link during the interval, i.e. adding the individual vehicle number of stops and then dividing by the number of vehicles that exit from the link during the interval.
Density-related measures
Density is computed, at each time step, by counting the number of vehicles in each lane of a link, dividing by the length of the lanes, and then, in order to convert to PCU density, also dividing by the heavy vehicle adjustment factor:
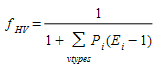
Where:
- P~i~ is the proportion of vehicles of type i
- E~i~ is the passenger-car equivalent (PCU) of vehicles of type i
The output for a time interval is computed averaging for all the time steps during the interval.
The LoS for a freeway section is determined based on the density in passenger-cars per mile per lane, according to the ranges in the following table.
| Level of Service | Density (PCU/mi per lane) |
|---|---|
| A 1 | ≤ 11 |
| B 2 | >11 and ≤18 |
| C 3 | >18 and ≤26 |
| D 4 | >26 and ≤35 |
| E 5 | >35 and ≤45 |
| F 6 | >45 or Q/C>1 |
The LoS for a weaving section is determined based on the density in passenger-cars per mile per lane determined by the ranges in the following table.
| Level of Service | Density (PCU/mi per lane) | |
|---|---|---|
| Freeways | Multilane Highways | |
| A 1 | ≤ 10 | ≤ 12 |
| B 2 | >10 and ≤20 | >12 and ≤24 |
| C 3 | >20 and ≤28 | >24 and ≤32 |
| D 4 | >28 and ≤35 | >32 and ≤36 |
| E 5 | >35 | >36 |
| F 6 | Q/C>1 | Q/C>1 |
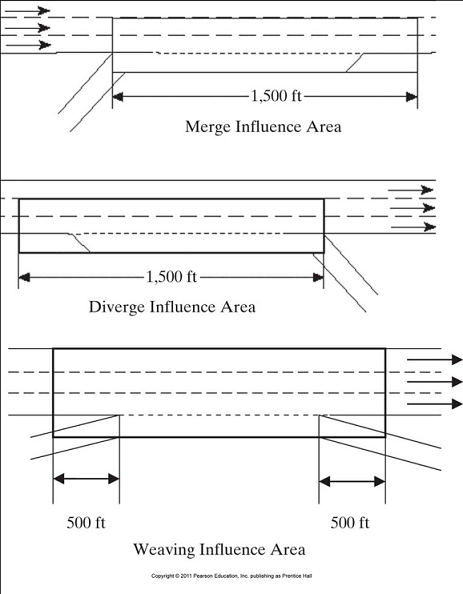
The LOS for a merge or diverge (on-ramp or off-ramp) is determined based on the density in passenger-cars per mile per lane considering only the ramp and the two lanes adjacent to the ramp for a distance of 1500ft from the merge or diverge point as shown below according to the ranges in the following table.
| Level of Service | Density (PCU/mi per lane) |
|---|---|
| A 1 | ≤ 10 |
| B 2 | >10 and ≤20 |
| C 3 | >20 and ≤28 |
| D 4 | >28 and ≤35 |
| E 5 | >35 |
| F 6 | Q/C>1 |
The LoS for multilane highways is determined based on the free-flow speed in mph and the density in passenger-cars per mile per lane, according to the ranges in the following table.
| Level of Service | FFS (mi/h) | Density (PCU/mi per lane) |
|---|---|---|
| A 1 | All | ≤ 11 |
| B 2 | All | >11 and ≤18 |
| C 3 | All | >18 and ≤26 |
| D 4 | All | >26 and ≤35 |
| E 5 | 60 | >35 and ≤40 |
| 55 | >35 and ≤41 | |
| 50 | >35 and ≤43 | |
| 45 | >35 and ≤45 | |
| F 6 | 60 | >40 |
| 55 | >41 | |
| 50 | >43 | |
| 45 | >45 |
Queue-related measures
Once the queuing state has been determined at each time step for all the vehicles in a section:
- The queue length is the number of vehicles in queuing state.
- The back of queue at this time step is the position (measured from the stop line) of the rear bumper of the vehicle in queue (in each lane) closest to the entrance of the link.
Queue length during an interval is computed averaging for all the time steps during the interval, i.e. adding the values for each time step and then dividing by the number of time steps during the interval.
Average back of queue during an interval is the average of the back of queue values at the time steps during the interval.
Maximum back of queue during an interval is the maximum between the back of queue values at the time steps during the interval.
Percent overflow is the fraction of time during an interval that the back of the queue reaches the entrance of the section.
Percent queued vehicles is, at each time step, the percentage of vehicles in queuing state on a link. The output for a time interval is computed averaging for all the time steps during the interval, i.e. adding the values for each time step and then dividing by the number of time steps during the interval.
Other measures
Percent slow vehicles is, at each time step, the percentage of vehicles on a link whose speed is less than 2/3 of their desired speed.
The output for a time interval is computed averaging for all the time steps during the interval, i.e. adding the values for each time step and then dividing by the number of time steps during the interval.
The LoS for an urban section is determined based on the average speed (as a percentage of free-flow speed), according to the ranges in the following table.
| Level of Service | Speed (% of FFS) |
|---|---|
| A 1 | > 85 |
| B 2 | >67 and ≤85 |
| C 3 | >50 and ≤67 |
| D 4 | >40 and ≤50 |
| E 5 | >30 and ≤40 |
| F 6 | ≤30 or Q/C>1 |
Aimsun does not support the Level of Service in the case of Average Replications.
Other methodological guidelines
Chapter 24 of the HCM also provides other methodological guidelines:
- The denied-entry delay, i.e. the time spent "waiting out", should be computed and accounted for in upstream links. This is presented separately in Aimsun Next as the time spent in a virtual queue.
- All performance measures that accrue over time and space shall be assigned to the time interval and link in which they occur, no matter if the cause is at some distant point downstream and started in a past interval.
Chapter 24 also provides some guidelines for users to follow:
-
The spatial and temporal boundaries of the analysis domain must include a period that is free of congestion on all sides.
-
The network must be properly warmed-up and stable before LoS measures are made. Aimsun Next provides a means of specifying a warm up period in the Experiment Editor.
-
Because the stochastic variation in a microsimulation model, performance measures have to be calculated averaging several runs; the number of runs n required to produce 95% confidence of achieving a maximum tolerable error

where
-
E~T~ is the maximum tolerable error
- s is the sample standard deviation