Path Analysis Tool
The Path Analysis Tool is used to inspect the routing in the traffic assignment (either static or dynamic) to gain insight into the behavior of drivers in the traffic network.
The two main tabs are:
-
Path Assignment: Examines the use and costs of the paths in the network. This tab is available in the replication or result editor for dynamic scenarios and in the experiment editor for static scenarios. This information is available provided the option Keep in Memory in the Scenario Outputs to Generate folder is checked, or whenever the APA file is available for retrieval.
-
En-Route Path Updates: Shows the shortest paths being considered from any section to a destination centroid according to the stochastic route choice. This tab is available in the replication or result editor for dynamic stochastic experiments. This information is available during the simulation, provided the option Keep in Memory in the Scenario Outputs to Generate folder is checked.
Path Assignment
This tab, in a dynamic replication or a static assignment experiment, is used to access the path assignment information. The information displayed differs depending on the assignment approach. When the assignment approach is Dynamic Traffic Assignment, the information can be visualized either during the simulation or at the end of the simulation. During the simulation, the current path assignment is displayed while at the end of the simulation the final state (those paths used during the last route choice cycle) is displayed, being all previous intervals also available. In a Static Assignment, the information can only be viewed after the assignment has been run.
In both cases, a table with all paths information is available. Clicking over a row/path, shows that path in the main 2D view window.
There are some filters which can be applied, to show paths by:
- User class: When the route choice takes into account different vehicle types for calculating the shortest path trees this filter is applied to display only those paths related to a specific user class.
- Time slice: Select a interval time slice or all intervals including or excluding the warm-up period. Warm-up intervals are indicated with the tag 'Warm-Up' before the time interval.
- Origin centroid: Select an origin centroid from the 2D view or select one from the drop down list.
- Destination centroid: Select a destination centroid from the 2D view or select one from the drop down list.
- Entrance section: When a centroid has more than one entrance connection, the different connections are considered as different sources of entrance vehicles. This filter can be used to display only those paths that are using a specific entrance section selected from the dropdown list of by clicking in the 2D window.
- Exit section: The same capability can be used to select paths by exit section.
- Using a section or a list or grouping of sections: This filter is used to show all paths that are using a selected section or a grouping of sections.
- Selected according to the number of vehicles assigned: Select all the paths with more than or less than a specified flow.
- Path Type: Select paths by type.
- RC: Route choice using shortest paths.
- PAR: Path assignment result.
- ODR: Origin/Destination route.
- TRJ: Trajectory path.
Vehicles on a Trajectory path (TRJ) are using paths that are different from their initial path. The change might be due to a missed turn in a microsimulation (eventually becoming lost) or finding a better path after the periodic route choice calculations (Path Updated En Route). Vehicles might also change to a TRJ path when forced to by a Traffic Management action such as closed turn or a destination change.
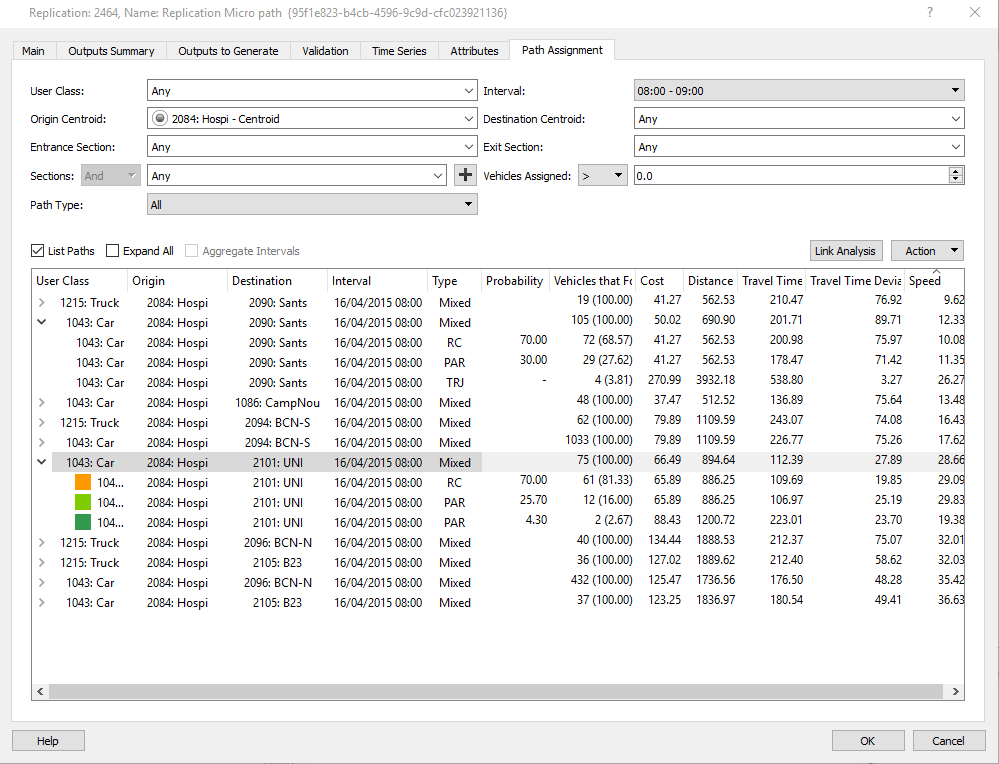
Once the filters have been selected, the display options are:
- List Paths: List the trips in the table. Clicking on a row expands it to show the multiple paths available for that OD pair. These paths are shown in the 2D view, in different colors, overlaid on the same road section where required.
- Expand All: Expands all the trips in the table to show the paths.
- Aggregate Paths. For Static assignments, when using a Incremental, MSA or Frank&Wolfe assignment method, Aimsun Next can show full set of paths in the order they have been obtained for each iteration or can be aggregated to show unique paths with the final usage percentages.
- Aggregate Intervals: Aggregates the path use for the whole simulation and removes the breakdown by time interval.
For each OD pair, the following information is displayed:
- User Class
- Origin and Destination Centroid
- Interval: The time interval. This is not shown if "Aggregate Paths" is selected.
- Paths Type: If the type is Mixed, several types of path have been used for that OD pair.
- Vehicles Generated: The number of trips generated for that OD pair.
- Vehicles Arrived: The number of vehicles that have completed their path in that interval.
- Cost: The average cost in time (seconds) of the paths in use weighted by the Vehicles Generated per path.
- Distance: The average distance (meters) of the used paths weighted by the Vehicles Generated per path.
- Travel Time: The average travel time in seconds experienced in the simulation on the used paths weighted by the Vehicles Arrived.
- Travel Time Deviation: The standard deviation of the average travel time for a dynamic assignment.
- Speed: The average speed (km/hr) for all paths used.
When expanding each OD pair, the same information for each path is displayed independently for each path type. The initial probability calculated by the model for each path and the vehicle numbers relevant to that path are also shown.
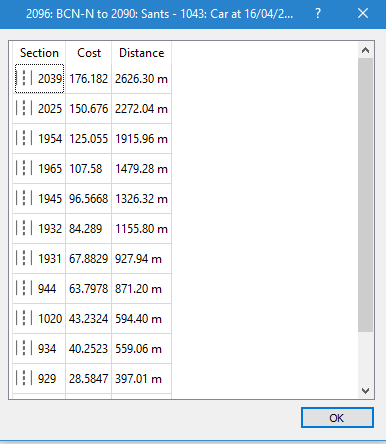
Detailed information of a path
The detailed information of a path can be obtained by double clicking on a path. This brings up a dialog with the total cost and distance from each section of the path to the destination.
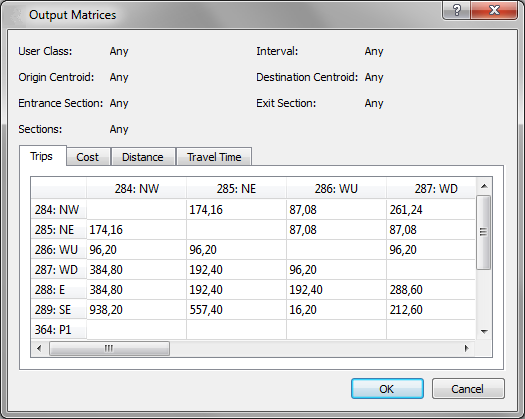
Actions
The actions that can be undertaken with the Path Analysis Data are:
- Create Routes from selected paths: This option creates OD Routes from the selected set of paths placing them in the OD Routes section of the Demand Data in the Project Folder.
- Create Routes from all paths: Creates OD Routes for all paths in the path analysis.
- Output Matrices: This option creates the skim matrices using the current filter values. There are four basic output skim matrices: trips, cost, distance, and travel time. In addition, for the static assignment, also the matrices corresponding to the Function Components defined will be calculated.
- Copy Data: This option copies the data in the paths table to the system clipboard, from where it can be pasted into other analysis software, i.e. a spreadsheet.
- Save and Retrieve Link Analysis: Saves the current link analysis into an ALA file in a linkAnalysis directory.
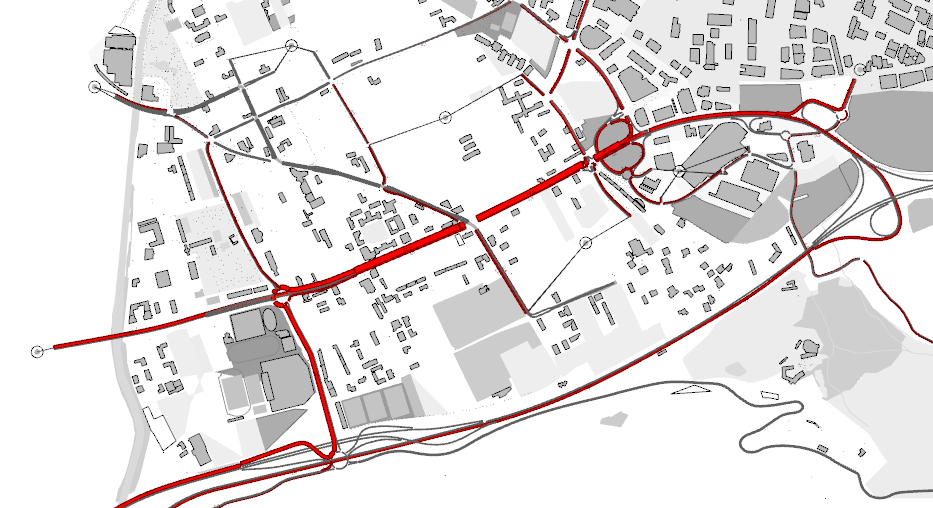
Link Analysis
A link analysis of a selected section, list or grouping of sections can be performed by clicking the Link Analysis button. A view mode to show the link analysis information is created and all paths going through the selected set of sections are shown with the volumes linked to those paths. By checking the Link Analysis checkbox, the view mode is switched to one where all the paths in the list are colored in red and the width of the bars on the sections with volumes is proportional to the volume on them.
The View Styles included in the Link Analysis View Mode are:
- A style for the width of each section, proportional to its volume.
- A style for the color: used sections are painted in red.
- A style for the label of the assigned volumes on the sections.
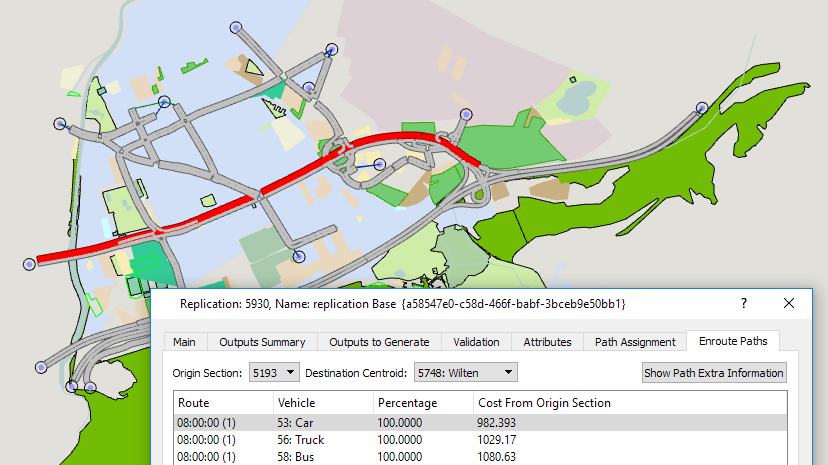
En-Route Path Assignment Update Information
When a vehicle reassigns its path during its trip, the decision is taken using probabilities calculated by the Route Choice model.
The En-Route Path Update dialog is located in the replication editor in the same way as the path assignment editor. Select an origin section and a destination centroid, either from the 2D map or from the dropdown boxes in the dialog tab. The table will display, for each vehicle type (and each exit connection if the destination centroid has destination percentages set) all shortest paths currently being considered by the simulation that go from the selected section to the destination centroid, each with its current cost and an associated probability of choice calculated applying the stochastic route choice model set in the experiment.