Calculation of Traffic Statistics
This section describes in detail the procedures applied to calculate the different traffic statistical measures. The individual vehicle data that needs to be gathered in order to produce the traffic statistics is also described.
Data is collected at intervals in the simulation specified in the Scenario Editor. At the end of each interval, the statistics that are accumulated relate to vehicles that have left the object that is collecting the statistics in that interval (i.e. a road section, a node, a turn, a sub path, or the replication). Due to the changes in congestion as the simulation runs, and hence the changes in travel times, the statistics for objects with different passage times (i.e. a short turn, a long section, a subpath with many sections) will not be self consistent in any single interval. For example a vehicle whose trip time is measured on a sub path can have used a road section, which is now congested, in a previous interval when it was uncongested, and hence summing the travel times of the sections and turns in a subpath in one interval might not necessarily give the same travel time as experienced by the vehicles that completed the subpath in the same interval. For this reason, statistics are generated for multiple types of objects and the modeler must select which are the most appropriate to use for the planned analysis.
Network Statistics 
Vehicle Data Gathering
The information gathered from an individual vehicle is:
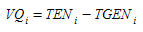
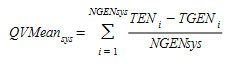
TGEN~i~ = Generation time of the i-th vehicle in the system (seconds).
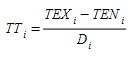
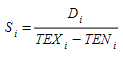
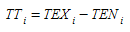
TEN~i~ = Entrance time of the i-th vehicle in the network (seconds).
TEX~i~ = Exit time of the i-th vehicle from the network (seconds).
D~i~ = Total Distance travelled by the i-th vehicle in the network (meters).
TDT~i~ = Total Delay Time accumulated in each section by the i-th vehicle (seconds).
TST~i~ = Total Stop Time accumulated in each section by the i-th vehicle (seconds).
TNS~i~ = Total Number of Stops accumulated in each section by the i-th vehicle.
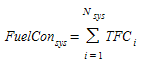
TFC~i~ = Total fuel consumed by the i-th vehicle(liters).
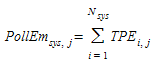
TPE~i,j~ = Total emission of the j-th pollutant by the i-th vehicle(Kg).
Taking this information, when a vehicle exits the network, the following variables are calculated:
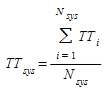
TT~i~ = Average travel time per km of the i-th vehicle (seconds).
DT~i~ = Average delay time per km of the i-th vehicle (seconds).

S~i~ = Average speed of the i-th vehicle (m/s).
HS~i~ = Inverse of Si (s/m), used for calculating the harmonic mean speed

ST~i~ = Average stop time per km of the i-th vehicle (seconds).

NS~i~ = Average number of stops per km of the i-th vehicle.

VQ~i~ = Time the i-th vehicle has spent in a virtual queue (seconds).
Traffic Statistics
The previous Vehicle Variables are used for calculating the simulation statistics output. The following traffic statistics are calculated for every statistics interval and for the whole simulation period:
I = Interval of statistics (seconds).
N~sys~ = Number of vehicles that exit the network during period I
F~sys~ = Mean Flow

In hybrid macro-meso simulations, N~sys_meso~ = Number of vehicles that exit the network during period I from the meso area N~sys_macro~ = Number of vehicles that exit the network during period I from the macro area Then the Meso and Macro Flows are calculated using N~sys_meso~ and N~sys_macro~ respectively.
TT~sys~ = Average Travel Time per vehicle per km.
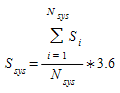
S~sys~ = Average Speed per vehicle (km/h)
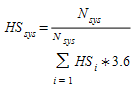
HS~sys~ = Harmonic mean Speed per vehicle (km/h)
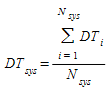
DT~sys~ = Average Delay Time per vehicle per km (seconds/km)
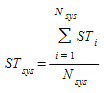
ST~sys~ = Average Stop Time per vehicle per km (seconds/km)
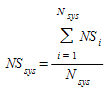
NS~sys~ = Average Number of Stops per vehicle per km
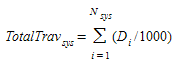
TotalTrav~sys~ = Total number of kilometers travelled by all the vehicles that have crossed the network (km)
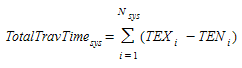
TotalTravTime~sys~ = Total travel time experienced by all the vehicles that have crossed the network (seconds)
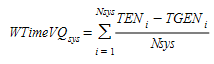
WTimeVQ~sys~ = Mean waiting time per vehicle in virtual queue (seconds)
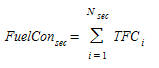
FuelCon~sys~ = Total fuel consumed by all the vehicles that have crossed the network (liters)
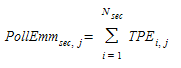
PollEm~sys,j~ = Total pollution of the j-th pollutant emitted by all the vehicles that have crossed the network (kg)
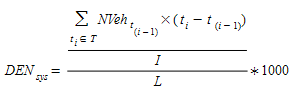
The lane density of the system is calculated as follows:
L = Total length of all lanes of all sections of the network (meters)
NVeh~t~ = Number of vehicles in the network at time t
i = Interval of statistics (seconds).
T = (0, t~1~, ..., t~m~, I) : instants when the number of vehicles in the network changes
NGEN~sys~ = Number of vehicles generated during period i
QVMean~sys~ = Mean waiting time per vehicle in virtual queue (seconds)
QVMax~sys~ = Maximum number of vehicles in virtual queue (vehs) in a simulation step in period i.
Turn and Section Statistics
Vehicle Data Gathering
The information gathered from an individual vehicle at every section is:
TEN~si~ = Entrance time of the i-th vehicle in the section (seconds).
TEX~si~ = Exit time of the i-th vehicle from the section (seconds).
TST~si~ = Total Stop Time accumulated in a section by the i-th vehicle (seconds).
TNS~si~ = Total Number of Stops accumulated in a section by the i-th vehicle.
TFC~si~ = Total fuel consumed accumulated in a section by the i-th vehicle (liters).
TPE~si,j~ = Total emission of the j-th pollutant accumulated in a section by the i-th vehicle (kg).
Taking this information, when a vehicle enters a new section the following variables are calculated:
TT~i~ = Average section travel time of the i-th vehicle (seconds).
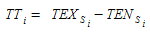
DT~i~ = Average section delay time of the i-th vehicle (seconds).
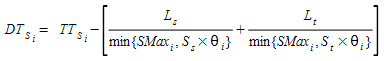
where
- Ss = Speed limit of section s (m/s).
- St = Speed limit of turn t (m/s).
- θ~i~ = Speed limit acceptance of vehicle i
- SMax~i~ = Maximum desired Speed of vehicle i (m/s).
- L~s~ = Distance of section s (meters).
- L~t~ = Distance of turn t (meters).
S~i~ = Average section speed of the i-th vehicle (m/s).

HS~i~ = Inverse of Si (s/m), used for calculating the harmonic mean speed.

ST~i~ = Stop time in the section of the i-th vehicle (seconds).

NS~i~ = Number of stops of the i-th vehicle.

Turn Traffic Statistics
The previous vehicle variables are used for calculating the turn statistics output. The following traffic statistics are calculated for every statistics interval and for the whole simulation period:
I = Interval of statistics (seconds)
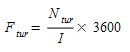
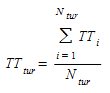
N~tur~ = Number of vehicles that exit a turn
F~tur~ = Mean Flow of a turn (veh/h)
TT~tur~ = Average Travel Time per vehicle of a turn (seconds)
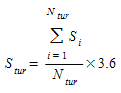
S~tur~ = Average Speed per vehicle of a turn (km/h)
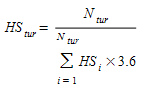
HS~tur~ = Harmonic mean Speed per vehicle of a turn (km/h)
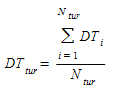
DT~tur~ = Average Delay Time per vehicle of a turn (seconds)
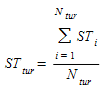
ST~tur~ = Average Stop Time per vehicle of a turn (seconds)
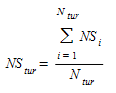
NS~tur~ = Average Number of Stops per vehicle of a turn
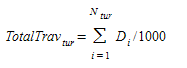
TotalTrav~tur~ = Total distance travelled by all the vehicles in the turn (km)
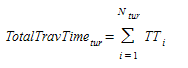
TotalTravTime~tur~ = Total travel time experimented by all the vehicles in the turn (seconds)
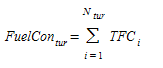
FuelCon~tur~ = Total fuel consumed by all the vehicles in the turn (liters)
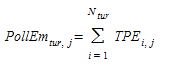
PollEm~tur,j~ = Total pollution of the j-th pollutant emitted by all the vehicles inside the turn (kg)
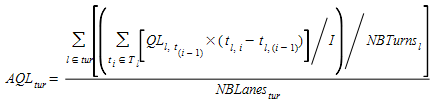
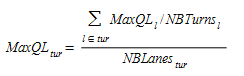
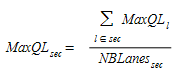
To calculate the average and maximum queue length of a turn (veh):
QL~l,t~ = Queue Length in the lane l at time t (veh)
MaxQL~l~ = Maximum queue length in lane l (veh)
NBTurns~l~ = Total number of allowed turns movements of the lane l
I = Interval of statistics (seconds).
T~l~ = (0, t~l,1~, ..., t~l,m~, I) : instants when the queue length in lane l changes
NBLanes~tur~ = Number of lanes that belong to turn tur
MaxQL~l~ = Maximum Queue Length in the lane l (veh)
Section Traffic Statistics
The previous Vehicle Variables are used for calculating the section statistics output. The following traffic statistics are calculated for every statistics interval and for the whole simulation period:
I = Interval of statistics (seconds).
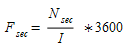
N~sec~ = Number of vehicles that exit a section
F~sec~ = Mean Flow of a section (veh/h)
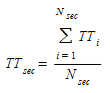
TT~sec~ = Average Travel Time per vehicle of a section (seconds)
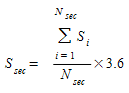
S~sec~ = Average Speed per vehicle of a section (km/h)
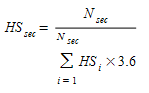
HS~sec~ = Harmonic mean Speed per vehicle of a section (km/h)
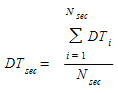
DT~sec~ = Average Delay Time per vehicle of a section (seconds)
ST~sec~ = Average Stop Time per vehicle of a section (seconds)
NS~sec~ = Average Number of Stops per vehicle of a section
TotalTrav~sec~ = Total distance travelled by all the vehicles in the section (km)
TotalTravTime~sec~ = Total travel time experienced by all the vehicles in the section (seconds)
FuelCon~sec~ = Total fuel consumed by all the vehicles in the section (liters)
PollEm~sec,j~ = Total pollution of the j-th pollutant emitted by all the vehicles inside the section (kg)
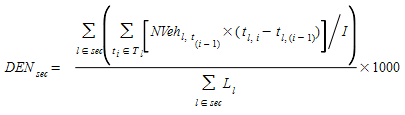
To calculate the density of a section:
L~l~ = Length of lane l (m)
NVeh~l,t~ = Number of vehicles in the lane l at time t
I = Interval of statistics (seconds).
T~l~ = (0, t~l,1~, ..., t~l,m~, I) : instants when the number of vehicles in lane l changes
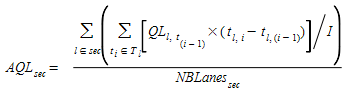
To calculate the average and maximum queue length of a section (veh):
QL~l,t~ = Queue Length in the lane l at time t (veh)
MaxQL~l~ = Maximum queue length in lane l (veh)
I = Interval of statistics (seconds).
Tl = (0, t~l,1~, ..., t~l,m~, I) : instants when the queue length in lane l changes
NBLanes~sec~ = Number of lanes of section sec
MaxQL~l~ = Maximum Queue Length in the lane l (veh)
Node Traffic Statistics 
The previously calculated Average Delay Time for the turns in a node and for the incoming sections are used for calculating the average intersection delay per vehicle (LOS, seconds) according to the following formula:
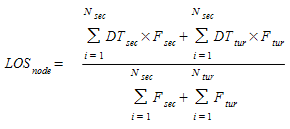
Where:
F~tur~ = Mean Flow of a turn (veh/h)
DT~tur~ = Average Delay Time per vehicle of a turn (seconds)
F~sec~ = Mean Flow of a section (veh/h)
DT~sec~ = Average Delay Time per vehicle of a section (seconds)
Subpath Statistics
Data Gathering
The information gathered from an individual vehicle at every subpath is:
TEN~i~ = Entrance time of the i-th vehicle in the subpath (seconds).
TEX~i~ = Exit time of the i-th vehicle from the subpath (seconds).
D~i~ = Total Distance travelled by the i-th vehicle in the subpath (meters).
TDT~i~ = Total Delay Time accumulated in each section of the subpath by the i-th vehicle (seconds).
TST~i~ = Total Stop Time accumulated in each section of the subpath by the i-th vehicle (seconds).
TNS~i = Total Number of Stops accumulated in each section of the subpath by the i-th vehicle.
TFC~i~ = Total fuel consumed accumulated in each section of the subpath by the i-th vehicle (liters).
TPE~i,j~ = Total emission of the j-th pollutant accumulated in each section of the subpath by the i-th vehicle.
Taking this information, when a vehicle exits the subpath the following variables are calculated:
TT~i~ = Average travel time for the i-th vehicle (seconds).
DT~i~ = Average delay time of the i-th vehicle (seconds).

S~i~ = Average speed of the i-th vehicle (m/s).

HS~i~ = Inverse of Si (s/m), used for calculating the harmonic mean speed

ST~i~ = Average stop time of the i-th vehicle (seconds).

NS~i~ = Average number of stops of the i-th vehicle.

Subpath Summaries
The previous Vehicle Variables are used for calculating the Subpath statistics output. The following traffic statistics are calculated for every statistics interval and for the whole simulation period:
I = Interval of statistics (seconds).
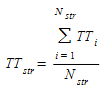
N~str~ = Number of vehicles that have crossed the subpath str.
TT~str~ = Average Travel Time per vehicle (seconds)
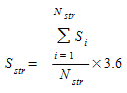
S~str~ = Average Speed per vehicle (km/h)
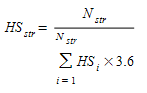
HS~str~ = Harmonic mean Speed per vehicle (km/h)
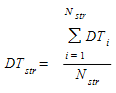
DT~str~ = Average Delay Time per vehicle (seconds)
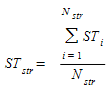
ST~str~ = Average Stop Time per vehicle (seconds)
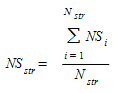
NS~str~ = Average Number of Stops per vehicle
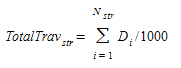
TotalTrav~str~ = Total distance travelled (km)
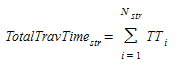
TotalTravTime~str~ = Total travel time experienced(seconds)
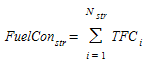
FuelCon~str~ = Total fuel consumed (liters)
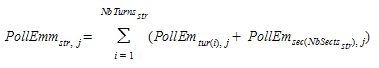
PollEm~str,j~ = Total pollution of the j-th pollutant emitted by all the vehicles in the subpath (kg)
OD and Centroid Statistics
Vehicle Data Gathering
The information gathered from an individual vehicle is as follows:
TEN~i~ = Entrance time of the i-th vehicle in the network (seconds).
TEX~i~ = Exit time of the i-th vehicle from the network (seconds).
D~i~ = Total Distance travelled by the i-th vehicle in the network (meters).
TDT~i~ = Total Delay Time accumulated in each section by the i-th vehicle (seconds).
TST~i~ = Total Stop Time accumulated in each section by the i-th vehicle (seconds).
TNS~i~ = Total Number of Stops accumulated in each section by the i-th vehicle.
TFC~i~ = Total fuel consumed accumulated in each section by the i-th vehicle (liters).
TPE~i,j~ = Total emission of the j-th pollutant accumulated in each section by the i-th vehicle (kg)
Taking this information, when a vehicle exits the system the following variables are calculated:
TT~i~ = Average travel time for the i-th vehicle (seconds).
DT~i~ = Average delay time of the i-th vehicle (seconds).
S~i~ = Average speed of the i-th vehicle (m/s).
HS~i~ = Inverse of Si (s/m), used for calculating the harmonic mean speed
ST~i~ = Average stop time of the i-th vehicle (seconds).
NS~i~ = Average number of stops of the i-th vehicle.
OD Pair Statistics
The previous Vehicle Variables are used for calculating the OD pair statistics output. The following traffic statistics are calculated for every statistics interval and for the whole simulation period:
I = Interval of statistics (seconds).
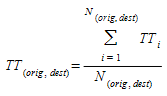
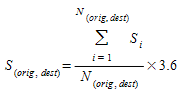
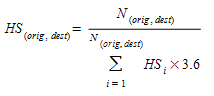
N~(orig,dest)~ = Number of vehicles that have reached its destination dest from its origin orig.
TT~(orig,dest)~ = Average Travel Time per vehicle (seconds)
S~(orig,dest)~ = Average Speed per vehicle (km/h)
HS~(orig,dest)~ = Harmonic mean Speed per vehicle (km/h)
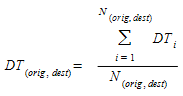
DT~(orig,dest)~ = Average Delay Time per vehicle (seconds)
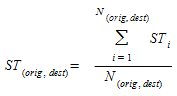
ST~(orig,dest)~ = Average Stop Time per vehicle (seconds)
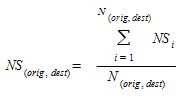
NS~(orig,dest)~ = Average Number of Stops per vehicle
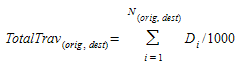
TotalTrav~(orig,dest)~ = Total distance travelled (km)
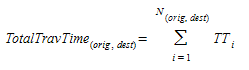
TotalTravTime~(orig,dest)~ = Total travel time experienced (seconds)
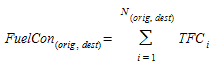
FuelCon~(orig,dest)~ = Total fuel consumed (liters)
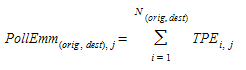
PollEm~(orig,dest),j~ = Total pollution emitted of the j-th pollutant (kg)
Origin Centroid Statistics
The previous Vehicle Variables are used for calculating the origin centroid statistics output. The following traffic statistics are calculated for every statistics interval and for the whole simulation period:
I = Interval of statistics (seconds).
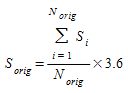
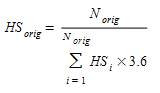
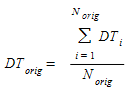
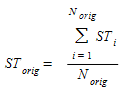
N~orig~ = Number of vehicles that have reached its destination from its origin orig.
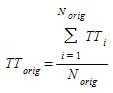
TT~orig~= Average Travel Time per vehicle (seconds)
S~orig~ = Average Speed per vehicle (km/h)
HS~orig~ = Harmonic mean Speed per vehicle (km/h)
DT~orig~ = Average Delay Time per vehicle (seconds)
ST~orig~ = Average Stop Time per vehicle (seconds)
NS~orig~ = Average Number of Stops per vehicle
TotalTrav~orig~ = Total distance travelled (km)
TotalTravTime~orig~ = Total travel time experienced (seconds)
FuelCon~orig~ = Total fuel consumed (liters)
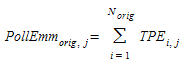
PollEm~orig,j~ = Total pollution emitted of the j-th pollutant (kg)
Destination Centroid Statistics
The previous Vehicle Variables are used for calculating the destination centroid statistics output. The following traffic statistics are calculated for every statistics interval and for the whole simulation period:
I = Interval of statistics (seconds).
N~dest~ = Number of vehicles that have reached their destination dest from their origin.
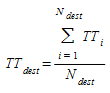
TT~dest~= Average Travel Time per vehicle (seconds)
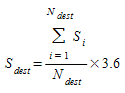
S~dest~ = Average Speed per vehicle (km/h)
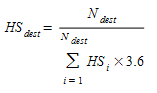
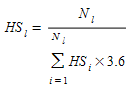
HS~dest~ = Harmonic mean Speed per vehicle (km/h)
DT~dest~ = Average Delay Time per vehicle (seconds)
ST~dest~ = Average Stop Time per vehicle (seconds)
NS~dest~ = Average Number of Stops per vehicle
TotalTrav~dest~ = Total distance travelled (Km)
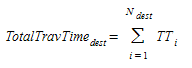
TotalTravTime~dest~ = Total travel time experienced (seconds)
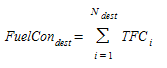
FuelCon~dest~ = Total fuel consumed (liters)
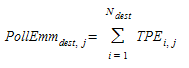
PollEm~dest,j~ = Total pollution emitted for the j-th pollutant (kg)
Transit Statistics
Vehicle Data Gathering
The information gathered from an individual transit vehicle is as follows:
TEN~i~ = Entrance time of the i-th vehicle into the network (seconds).
TEX~i~ = Exit time of the i-th vehicle from the network (seconds).
D~i~ = Total Distance travelled by the i-th vehicle in the network (meters).
TDT~i~ = Total Delay Time accumulated in each section by the i-th vehicle (seconds).
TST~i~ = Total Stop Time accumulated in each section by the i-th vehicle (seconds).
TNS~i~ = Total Number of Stops accumulated in each section by the i-th vehicle.
TFC~i~ = Total fuel consumed accumulated in each section by the i-th vehicle (liters).
TPE~i,j~ = Total emission of pollutant j-th accumulated in each section by the i-th vehicle (kg)
Taking this information, when a transit vehicle exits the system the following variables are calculated:
TTi = Average travel time for the i-th vehicle (seconds).
DTi = Average delay time of the i-th vehicle (seconds).
Si = Average speed of the i-th vehicle (m/s).
HSi = Inverse of Si (s/m), used for calculating the harmonic mean speed
STi = Average stop time of the i-th vehicle (seconds).
NSi = Average number of stops of the i-th vehicle.
Transit Line Statistics
The previous Vehicle Variables are used for calculating the transit line statistics output. The following traffic statistics are calculated for every statistics interval and for the whole simulation period:
I = Interval of statistics (seconds).
N~l~ = Number of vehicles that have completed the l-thtransit line.
TT~l~= Average Travel Time per vehicle (seconds)

S~l~ = Average Speed per vehicle (km/h)

HS~l~ = Harmonic mean Speed per vehicle (km/h)
DT~l~ = Average Delay Time per vehicle (seconds)

ST~l~ = Average Stop Time per vehicle (seconds)

NS~l~ = Average Number of Stops per vehicle

TotalTrav~l~ = Total distance travelled (km)
TotalTravTime~l~ = Total travel time experienced (seconds)
FuelCon~l~ = Total fuel consumed (liters)
PollEm~l,j~ = Total pollution emitted for the j-th pollutant (kg)
Detector Data Gathering
This section describes in detail the procedures applied to produce the different traffic detection measures, as well as the individual vehicle data that is gathered.
Each Detector has two types of measures gathered, these are set at the Scenario / Outputs to Generate folder:
- Detection Interval: Detection is aggregated during a time period.
- Detection Cycle: Detection done each cycle of detection.
Each detector stores the following variables:
- Veh (cycle): Set of Vehicles that have entered during last Cycle.
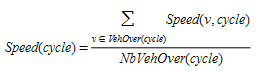
- VehOver (cycle): Set of Vehicles that have passed over the detector during last Cycle.
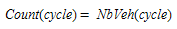
- NbVeh (cycle): Number of Vehicles that have entered during last Cycle.
- NbVehOver (cycle): Number of Vehicles that have passed over the detector during last Cycle.
- Speed (v, cycle): Speed of Vehicle v during last Cycle.
- EntranceTime (v, cycle): Time of Vehicle v that has entered during last Cycle.
Cycle Detection Measures
- Count: number of vehicles that have passed through the detector during the last cycle (vehicles).
- Speed: mean speed of the vehicles when are over the detector during the last cycle (km/h or mph).
- Presence: 1 if any vehicle is over the detector during the last cycle, 0 otherwise.
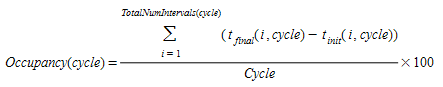
- Occupancy: percentage of cycle time that the detector has detected presence during last cycle (%).
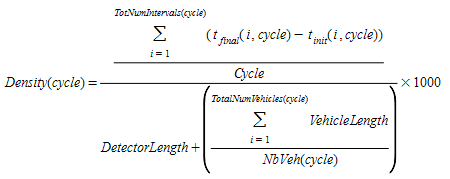
- Density: average spatial occupancy that the detector has detected during last cycle (veh/km).
Interval Detection Measures
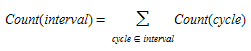
- Count: number of vehicles that have passed through the detector during the interval (vehicles).
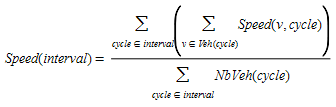
- Speed: mean speed of the vehicles when crossing the detector during the interval (km/h or mph). The speed of a vehicle is gathered when it crosses the detector for the first time (that is, for the first Cycle when the vehicle enters the detector).
- Presence: 1 if any vehicle is over the detector during the last interval, 0 otherwise.
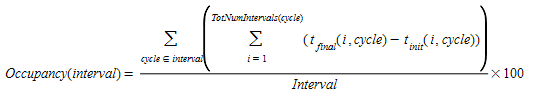
- Occupancy: percentage of cycle time that the detector has detected presence during the interval (%).
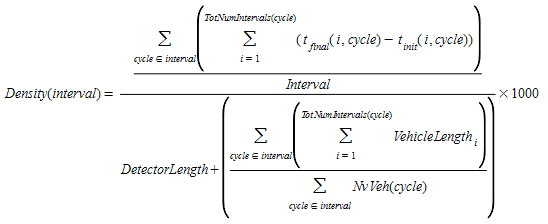
- Density: average spatial occupancy that the detector has detected during the interval (veh/km).
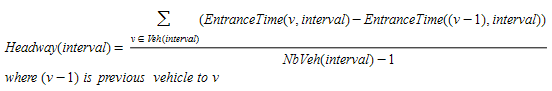
- Headway: mean headway of the vehicles when crossing the detector during the interval (seconds) where (v-1) is the previous vehicle to v.
Comparison with Real Data
Detector output can be compared with data in a Real Data Set. The quantified values used in the comparison are:
- GEH: A measure used to quantify differences in hourly flows.
- Thiel's U: A measure of goodness of fit which can further broken down to measure the goodness of fit for the mean, for the variance, and for the correlation between modelled and observed flows.
Customization of Statistics Output
The ‘Output' tab of the Scenario editor can be used to define the type of statistics produced as simulation output and whether or not they are stored in files. This must be carried out before running a simulation experiment because the report parameters cannot be modified once a simulation experiment has started.
Explanation of Statistics Outputs
Number of Stops
A stop for a vehicle happens whenever its speed decreases below the queue entry speed and while it remains below the queue exit speed parameter. Once the vehicle speed goes above the queue exit speed parameter the vehicle is no longer considered in a queue nor stopped. A new stop will be added to the number of stops statistics when the vehicle speed goes below queue entry speed again.
Stop Time
The stop time for a vehicle takes into account all the time the vehicle speed was below the vehicle's queue entry speed and until it goes above the queue exit speed parameter.