Transit OD Adjustment
Transit OD Adjustment
The Transit Demand can be adjusted based on transit passenger counts on the network. The passenger counts can be defined at detector locations and also the boarding and alighting numbers at a transit stop, both by transit line or aggregated over all transit lines.
Real Data Set for Transit
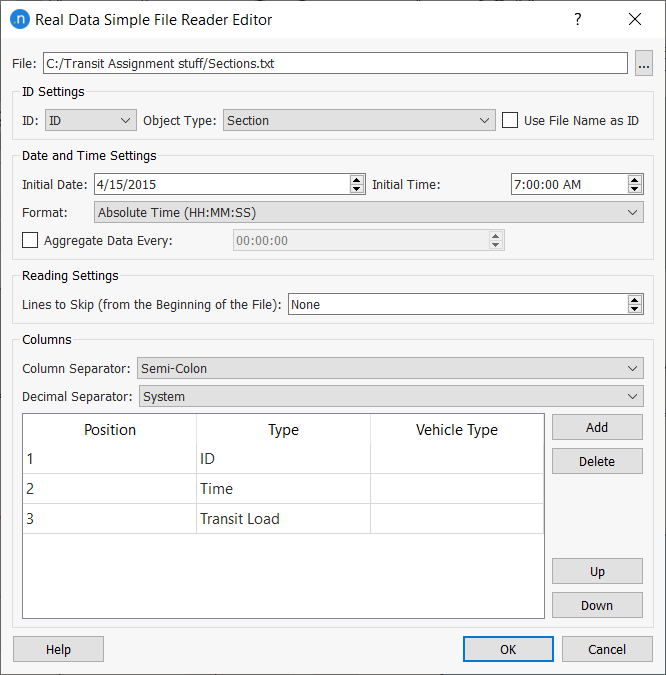
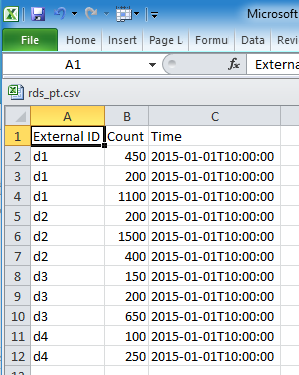
The passenger counts are held in a Real Data Set. Transit load counts must be specified at detector locations as shown in the next example. If the transit line is not given, an aggregated load for all lines is assumed.
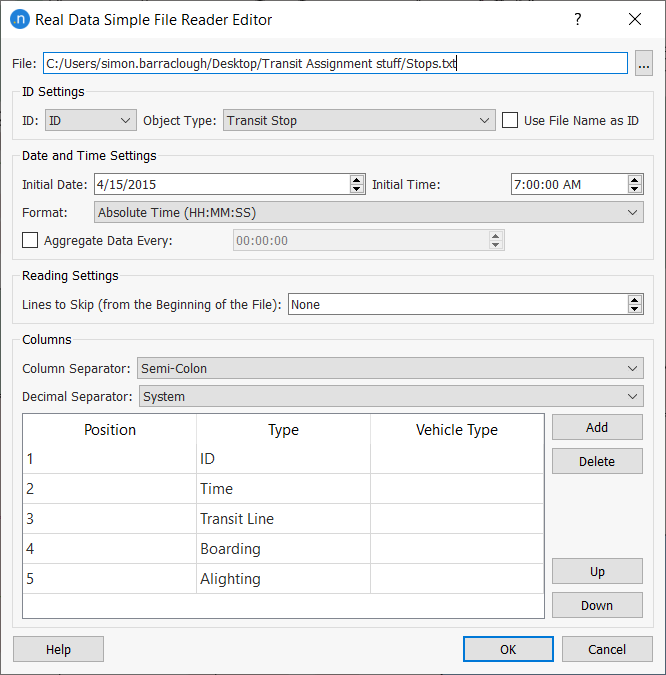
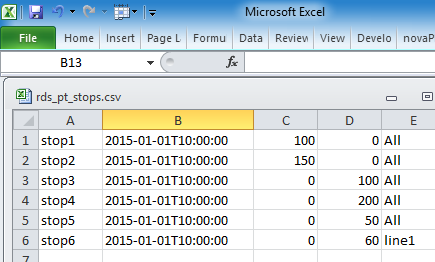
Similarly, the boarding and alighting counts at stops can be specified as in the next example:
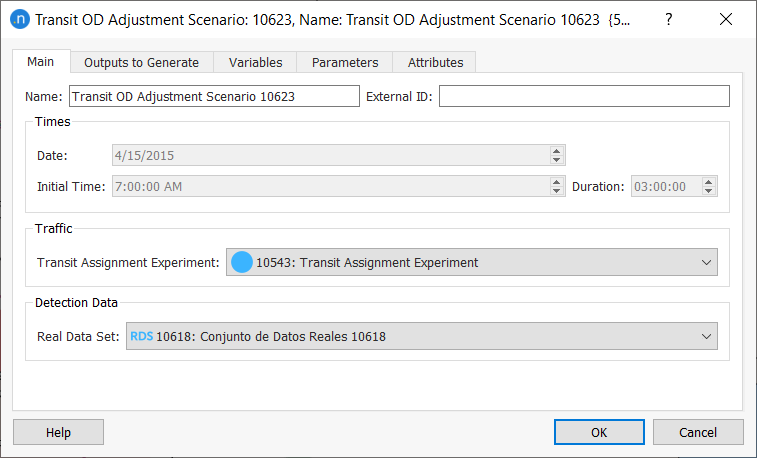
Transit OD Adjustment Scenario
A new Transit OD Adjustment Scenario must be created in the Project Scenarios folder. This is used to specify:
- the Transit Assignment Experiment which will be the basis for the adjustment
- the Real Data Set which contains the detector and bus stop passenger counts.
Transit OD Adjustment Experiment
A Transit OD Adjustment Experiment is created for the Transit OD Adjustment Scenario using the context menu. The experiment can be run using its context menu.
The experiment editor is used to adjust the experiment parameters and to display the results.
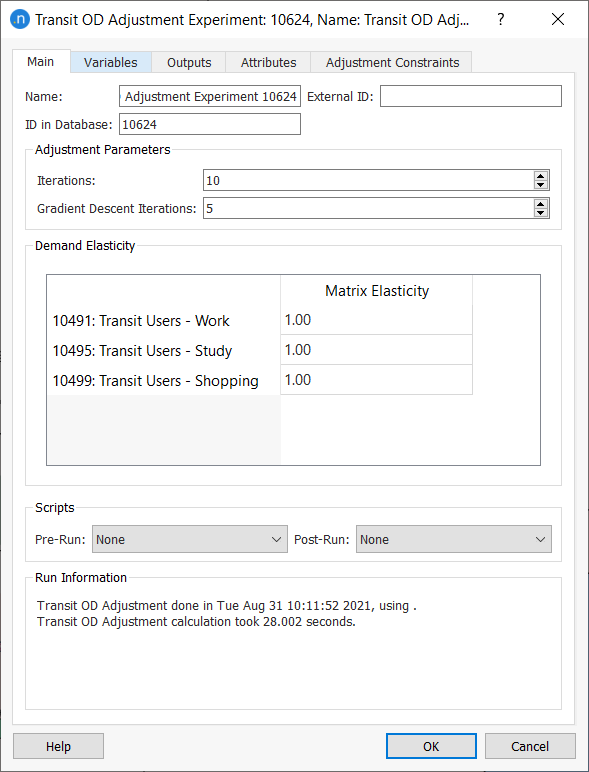
Main Tab
In the main tab specifies the following parameters:
- Number of Iterations. At each iteration of the Adjustment, the process will execute a Transit Assignment and use the paths it produces. The Transit Assignment executed at each iteration will be of the same type as the one selected in the Transit Adjustment Scenario but with the updated demand.
- Number of Gradient Descent Iterations. For each iteration of the Adjustment procedure, the number of iterations of the Gradient Descent Method that will be executed without changing the path choice results, that is, without executing a new Transit Assignment.
- Demand Elasticity. A value between 0 and 1 to indicate the elasticity of the adjusted matrix w.r.t. to the original matrix. A zero value means that no variation is allowed and 1 means no variation is penalized. A value of 0.5 implies equal weighting to the dual goals of maintaining the prior matrix value and matching the detector value.
- Pre run and post run scripts: Python scripts which can be used to prepare the inputs to the experiment or post process the outputs.
Output Tab
The results of the adjustment process will be shown in the Output tab.
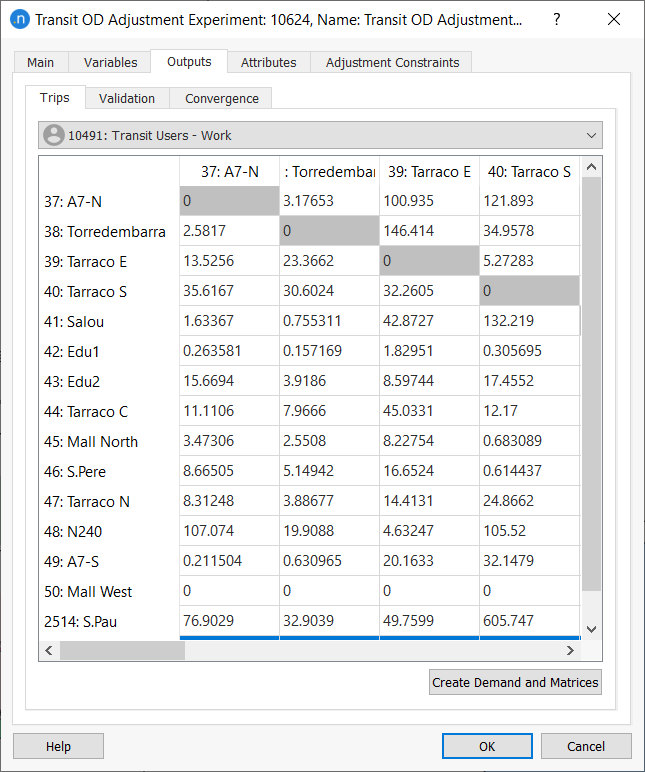
Trips Tab
Under the Trips tab the adjusted matrices can be viewed and a new Transit Travel Demand object generated.
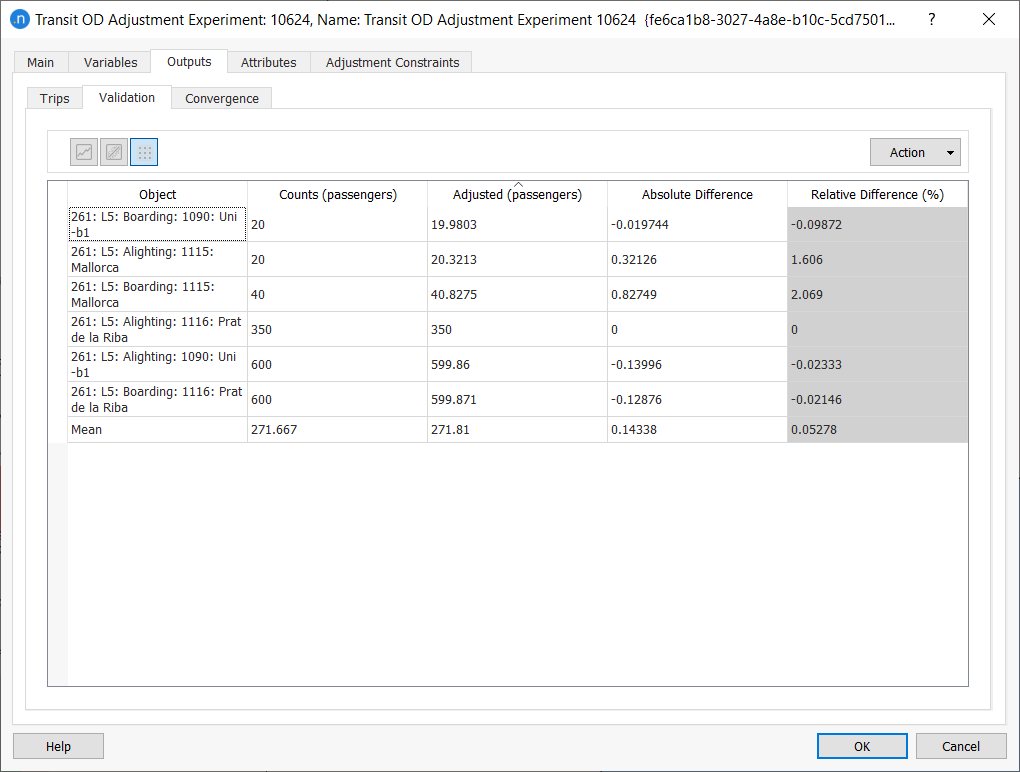
Validation Tab
Under the Validation tab the adjusted demand is compared with the specified counts in the Real Data Set. The data can be viewed as table, as a comparison plot or as a regression plot.
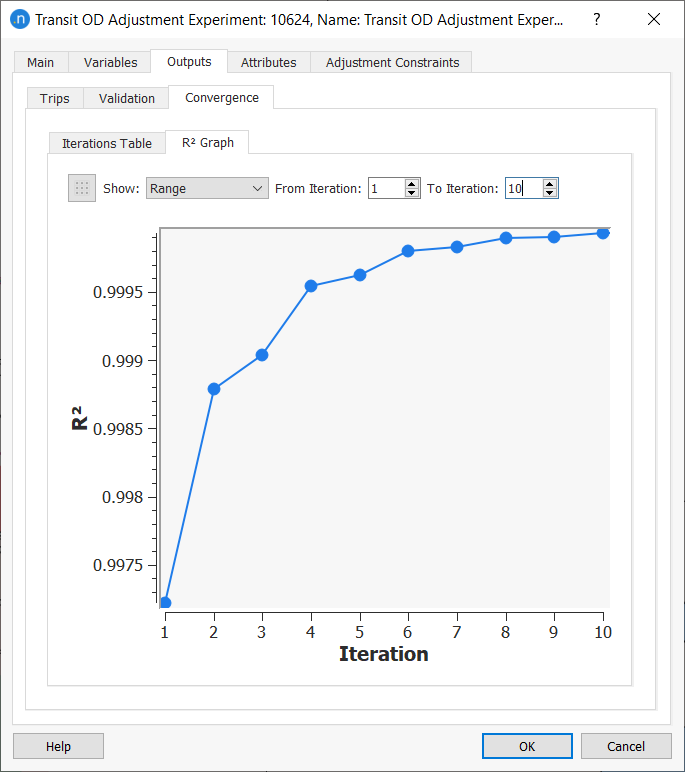
Convergence Tab
The convergence of the adjustment process is shown in the Convergence tab as a table or as a graph of R^2^ values.
Adjustment Contraints Tab
On this tab, the Grouping Options and the Maximum OD Deviation per user class are specified.
![]()
The Grouping Categories are used to merge counts from centroids and detectors to improve the robustness of the adjustment process. Groupings in a Transit adjustment are used in the same way as they are in the Static Adjustment Process.
The Maximum OD Deviation matrix is used to specify a matrix (with Contents: Max Deviation) per user class to limit the changes in the traffic demand with respect to the original demand. It is used in the same way as the Adjustment Maximum Deviation in the Static Adjustment Section.