Static OD Departure Adjustment
The Static OD Departure Adjustment is a procedure to create a profiled demand from a static demand. To obtain this profiled demand, the original static demand is distributed through smaller intervals over the time period. The objective is to reproduce the observed traffic counts specified in the Real Data Set per interval, staying as close as possible to the original number of OD pair trips for the whole period. Thus, it is important to start the process with a calibrated demand that fits the detection data over the scope of the model. The Static OD Departure Adjustment does not calculate any new assignment,it takes previously calculated fixed paths from an Path Assignment produced earlier and link (section + turn) travel times which are used to calculate the assigned number of vehicles for each time period. The method employed by the Static OD Departure Adjustment scenario is described in the Static OD Departure Adjustment Algorithms section.
To execute a Static OD Departure Adjustment; create a Static OD Departure Adjustment Scenario and an Experiment. The scenario will contain all the input data, and the experiments created from this scenario will contain the algorithm parameters.
The result of the departure adjustment is a set of matrices that form a profiled Traffic Demand.
Static OD Departure Adjustment Scenario
The Static OD Departure Adjustment Scenario editor contains the input data for the departure adjustment execution.
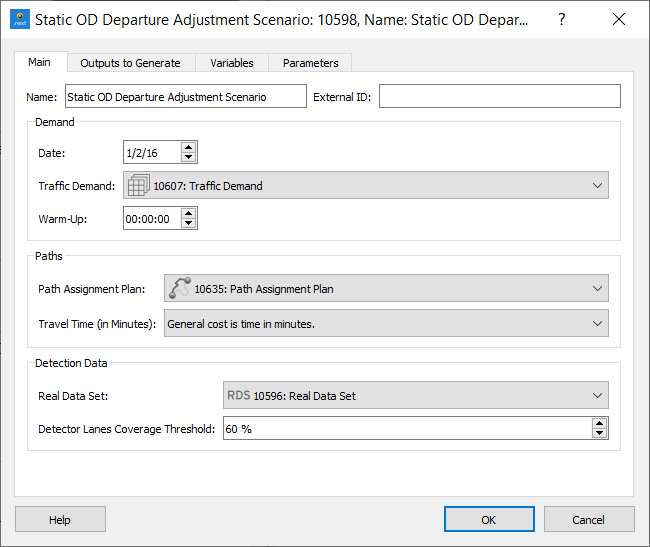
Main tab
The main tab defines the scenario in particular, the Traffic Demand and the Warm-up duration, the path assignment, and the real data set.
Demand
The initial Traffic Demand can be a single matrix covering the whole period, there is no requirement to profile it prior to running the departure adjustment experiment. This is included as the first step in the process; to split the matrix into multiple matrices using the time intervals in the Real Data Set, so if the data contains counts at 10 minute intervals, a 1 hour prior OD matrix will be split into 6 matrices which will be initialized with 1/6 of the overall demand.
Because the Departure Adjustment takes into account the travel time from origin to the detectors, the results for the first time intervals might be unrealistic if the network is not correctly loaded with vehicles at the start of the assessed period, therefore a warm-up time is recommended and the Traffic Demand will then be automatically extended to operate before it's initial time. If there is detection data for the warm-up period, the demand for the warm-up will be allocated a matrix in proportion to the total vehicle count in the warm up period and the modelled period. If no detection is available for the warm-up, it will receive a flat demand equal to the initial estimated profiled demand for the first interval.
Paths
The Paths info is defined by specifying a Path Assignment object obtained from a Static Assignment or a Static OD Adjustment. The travel time is calculated with the assumption that the generalized costs of the Path Assignment represent solely the travel time and that it is provided in minutes. If this is not the case, i.e. when the generalized cost includes a toll or a distance component or the cost units are not minutes, a Function Component must be defined in the static cost functions to provide the travel time in minutes. This Component must then be selected in the Travel Time [minutes] box.
Detection Data
The Detection Data is defined by specifying the Real Data Set that contains the counts from detectors or detector stations in the network. The Detector Lane Coverage Threshold determines the percentage of lanes a detector and/or detector station should cover in order to be included in the adjustment process.
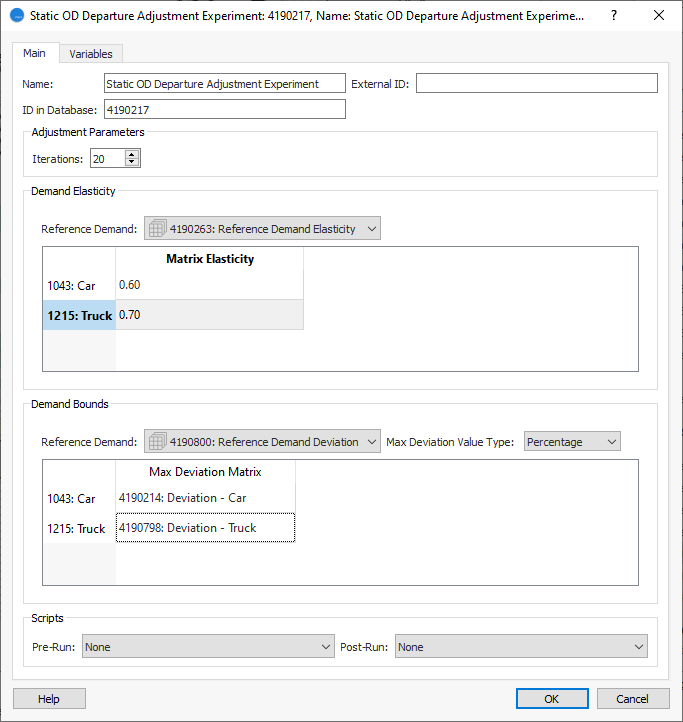
Static OD Departure Adjustment Experiment
Create a Static OD Departure Adjustment experiment from the Static OD Departure Adjustment Scenario context menu.
In the main tab: specify the following parameters:
- Number of Iterations The number of iterations that will be performed.
- Demand Elasticity per User class: A value between 0 and 1 to indicate the elasticity of the adjusted demand with respect to the Reference Demand. A zero value (not allowed by graphical user interface) would mean that no variation is allowed and 1 means variation is not penalized at all. The default value is 0.5. This implies equal weighting to the dual goals of maintaining the prior matrix value and matching the detector value.
- Maximum Deviation Permitted: Select the Value Type: Percentage, Factor or Absolute, and specify a matrix (with Contents: Max Deviation) per User Class to limit the changes in the traffic demand with respect to the Reference Demand, or leave None if no bounds are specified. Refer to Adjustment Maximum Deviation Section for more details.
The process is run from the context menu of the Static OD Departure Adjustment Experiment.
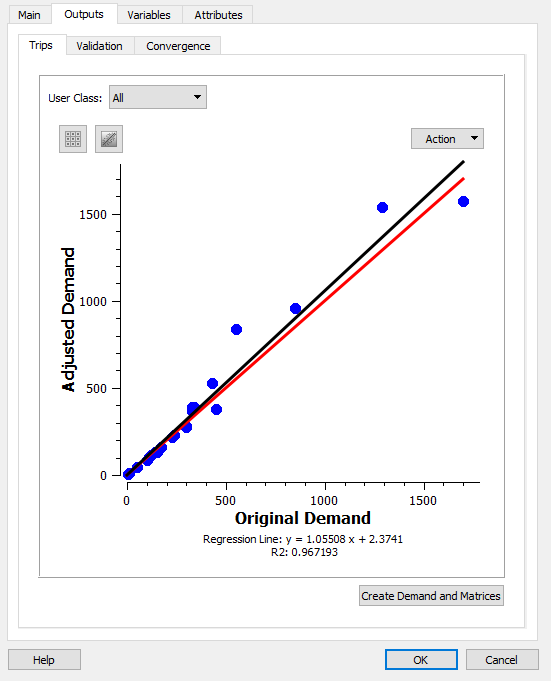
Static OD Departure Adjustment Outputs, Trips
The result of the Departure Adjustment is a set of profiled matrices, with the same interval as the data in the Real Data Set. Create the new Traffic Demand to include these OD matrices by clicking the Create Demand and Matrices button.
In the graph, the total adjusted demand (by user class if selected) is compared with the original demand in tabular form or as a regression plot as shown here.
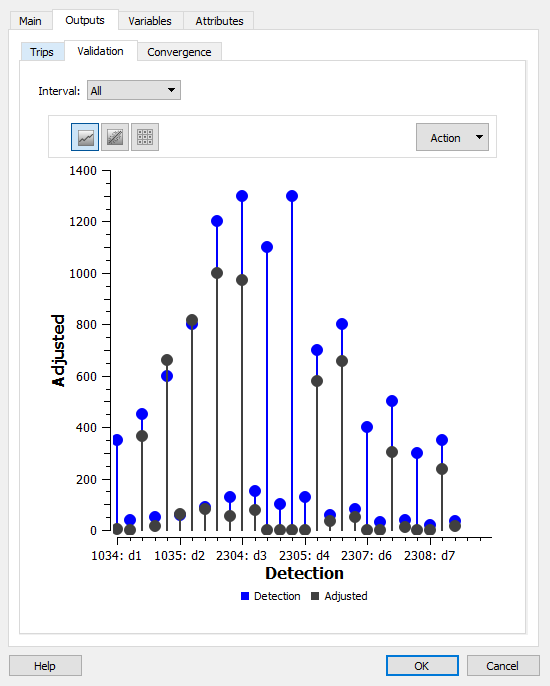
Static OD Departure Adjustment Outputs, Validation
The Validation tab is used to compare the results (only the last iteration) with the Real Data Set. Results for all intervals or for a selected interval are shown as a regression plot, as a table, or, as shown here, as a stick plot.
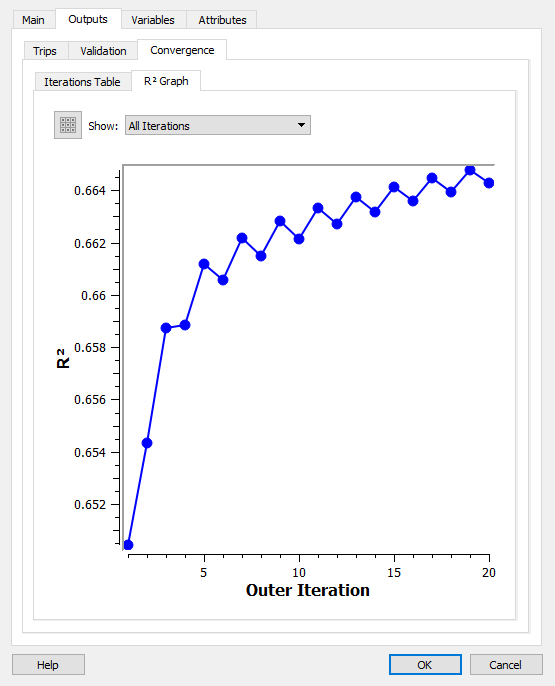
Adjustment Outputs, Convergence
This subtab shows how the R^2^ has changed at each iteration also in graphical or tabular form.